
As a trader, you have figured out what an EMA is.
Now let’s take it one step further and check: is moving average a good indicator?
Yes, it is, but if you want to read the stock market direction faster and make more accurate calls on whether the market is bullish or bearish, the 20 and 50 EMA crossover is worth learning.
Quick warning: this is not a magic tool. But it does make spotting the trend a lot easier than staring at 6 different indicators at the same time.
20 EMA Meaning
The 20 EMA has a short memory. It only tracks the last 20 candles, which means it reacts quickly to new price moves and shows you the short-term trend as it develops.
So instead of watching a stock jump 10% because you waited too long for the trend to “feel safe,” by using 20em, you already have a profitable position before most traders even notice the trend.
50 EMA Meaning
The 50 EMA has a long memory. It tracks the last 50 candles, which means it reacts slowly to price moves and shows you the bigger trend direction.
It filters out the small price spikes that look like trend changes but aren’t, so instead of reacting to every small move, you stay focused on where the market is actually going.
20 and 50 EMA Strategy
The main reason traders use the 20 and 50 EMA strategy is its effectiveness in identifying trends because most traders lose money not because they can’t read charts, but because they enter too early or too late to enter in right time.
Since this method relies on a specific moving average calculation, the 20 and 50 EMA crossover helps in determining the right timing for trades.
This strategy:
- Provides clear signals for buying and selling.
- Helps in trend confirmation.
- Reduces confusion from price fluctuations.
By recognizing the interplay between the two EMAs, traders can make profitable decisions.
How to Implement the 20 and 50 EMA Strategy?
- Choose Your Time Frame: Decide on the time frame that suits your trading style. Day traders may opt for shorter time frames ( from 5 to 15 minutes), while swing traders might choose longer ones ( 1-4 hours).
- Set Up Your Chart: Use a trading platform to plot the 20 EMA and 50 EMA on your chart. Adjust the settings to reflect your chosen time frame.
- Identify Crossovers: Look for points where the 20 EMA crosses the 50 EMA.
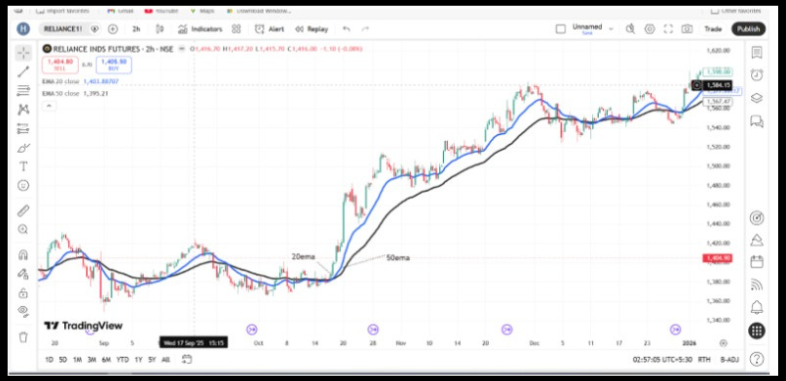
In this graph, blue is 20 EMA and black is 50 EMA
Bullish Crossover – When the 20 EMA cuts the 50 EMA from below and moves above it, buyers are stepping in, and the stock value starts moving up. That’s your buy signal.
But don’t jump in the moment you see the crossover. Wait and watch the next candle; if it’s moving up, enter the trade.
If it’s going down, skip it. Because sometimes even after a bullish crossover, the price can dip before going up, and you don’t want to get caught in that.
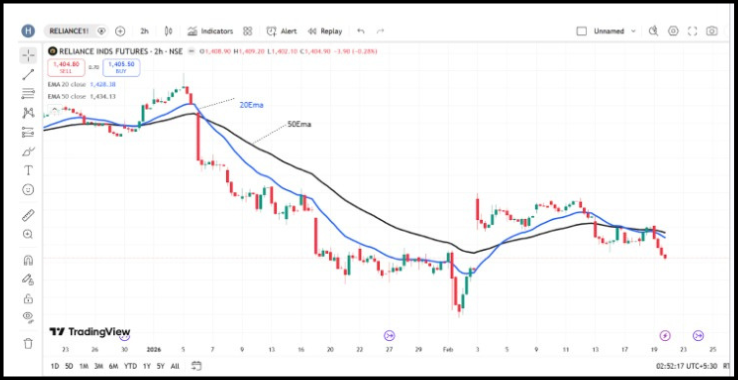
Bearish Crossover – When the 20 EMA crosses below the 50 EMA, sellers step in, and the stock price starts to drop. That’s your sell signal.
The same rule applies here: don’t jump in the moment you see the crossover. Wait and watch the next candle; if it’s moving down, enter the sell trade. If it’s going up, skip it.
Because sometimes even after a bearish crossover, the price can bounce up before dropping, and you don’t want to get trapped in that.
Pull back in 20 and 50 EMA Crossover
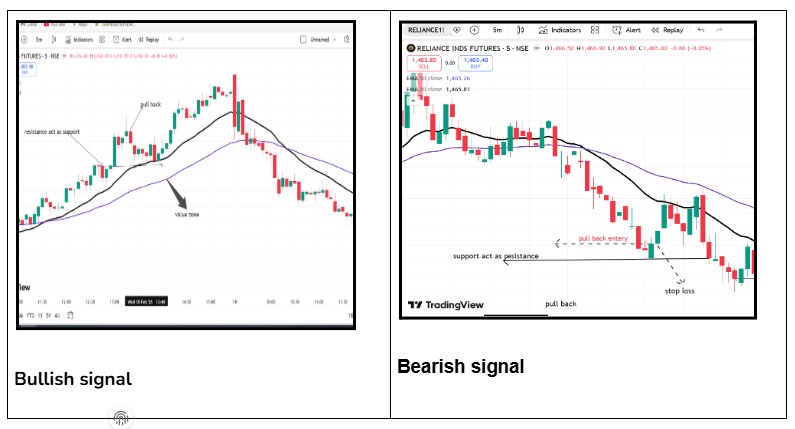
A pullback is a temporary retracement toward the 20 and 50 EMA after a confirmed crossover.
Instead of chasing the breakout, traders wait for the price to return to the value zone, the area between the 20 and 50 EMA, where dynamic support increases the probability of trend continuation and improves risk management.
Key Strategies for 20/50 EMA Pullback:
- Bullish Setup: Wait for the 20 EMA to cross above the 50 EMA, signaling a new uptrend.
- Pullback Entry: Instead of chasing the breakout, wait for the price to drop back to touch or short cross the 20 or 50 EMA, which acts as support.
- Confirmation: Confirm the entry with a green (bullish) candle after the pullback.
- Bearish Setup: Conversely, a 20 EMA crossing below the 50 EMA indicates a bearish trend for shorting opportunities.
- Place it below the 50 EMA or slightly below the recent swing low in Bullish Setup
- Place it below the 50 EMA or slightly above the recent swing low in a bearish Setup
Conclusion
Is the 20 EMA and 50 EMA Strategy Reliable?
Not always, sometimes a news update, company announcement, or political event pushes the price hard, and that move has nothing to do with the trend. In that case, the crossover is useless.
And when the market is sideways, buyers and sellers are just fighting each other with no one actually winning, like a tug of war that never ends.
The EMAs keep crossing each other, making it harder to understand the trend.
So don’t make the crossover your only rule. Keep it as one confirmation out of 2 or 3 before you enter a trade.
Now, if you’re serious about trading in the stock market and want to master technical indicators, then join our Technical Analysis classes and learn directly from the market experts.
FAQ
Q1: Does the 20 and 50 EMA crossover work in all market conditions?
Ans: No. It works best in trending markets. In a sideways market, the EMAs keep crossing back and forth, making signals unreliable. Always use it as one confirmation out of 2 or 3 before entering a trade.
Q2: What timeframe works best for the 20 and 50 EMA crossover?
Ans: It depends on your trading style. Day traders can use shorter timeframes like 15-minute or 1-hour charts. Swing traders typically use daily or weekly charts for more reliable signals.
Q3: Should I use the 20 and 50 EMA crossover as my only indicator?
Ans: No. Use it as one confirmation out of 2 or 3 before entering a trade. Relying on it alone will get you caught in false signals, especially in sideways markets.
Before investing capital, invest your time in learning Stock Market.
Fill in the basic details below and a callback will be arranged for more information: