
The fastest price moves happen not because of long-term investors, but because of panicked sellers in the stock market.
When traders who have “shorted” a stock (trade on a price fall) start losing money, they rush to buy back their positions to prevent further losses.
This “forced buying” creates a sharp upward spike known as a short covering rally.
As a trader, if you know how to find short covering stocks, you can ride these explosive moves for profits.
Here is a simple, step-by-step guide to identifying these opportunities in the live market.
How to Identify Short Covering?
Short covering leaves behind clear footprints in price, derivatives data, and market behavior.
This short covering happens whenever a sudden shift in sentiment forces the “bears” to quickly abandon their positions to avoid heavy losses.
If you know what to look for, you can quickly separate a normal price rise from a forced rally driven by trapped sellers.
Instead of guessing, focus on specific signals that reveal when bears are exiting in panic.
Here are the 5 most important signs you should track:
1. The Magic Formula: Price Up + OI Down
The most reliable way to identify short covering is by looking at the relationship between Price and Open Interest (OI).
While many traders ask does short covering increase price significantly, the answer lies in the sheer urgency of trapped sellers.
Open Interest tells you the number of active contracts in the market, and when those contracts are closed in a hurry, the resulting buying pressure pushes the price higher.
To find short covering, look for this specific combination:
- Stock Price: Is rising (Green candles).
- Open Interest: Is falling (Negative change in OI).
When the price goes up, but the OI goes down, it confirms that the dominant force driving the price higher is old sellers closing their positions rather than fresh buyers entering.
Some new buyers may still be entering simultaneously, but the net OI decline tells you that short covering is the primary engine of the move.
This Price Up + OI Down combination is your most reliable real-time signal for short covering.
2. Use the NSE Website or Trading Tools
You don’t need expensive software to find these stocks. You can use the official NSE India website:
- Go to the ‘Live Market’ section and select ‘Equity Stock (Derivative)’.
- Look for the “Most Active” or “OI Gainers/Losers” section.
- Filter for stocks where the Price Change % is Positive but the OI Change % is Negative.
For Chartink, there is no pre-built one-click short covering filter. You need to build a custom scanner manually using these conditions:
- Close > Previous Close (price is rising)
- OI Change % < 0 (open interest is falling)
- Volume > 20-day average volume (move is backed by participation)
Save this as a custom scan and run it during market hours to get a live list of short covering candidates.
This custom scanner on Chartink is actually more flexible than pre-built filters because you can add additional conditions like sector filters or minimum price thresholds.
3. Identify “Trapped” Sellers at Resistance
Short covering usually happens at major resistance levels or round numbers, and learning how to predict short covering begins with identifying these key zones before the price hits them.
For example, if a stock like Reliance Industries has a massive amount of Call writing at ₹3,000, that is a “seller’s fortress.”
If the stock price crosses ₹3,010 and stays there, the sellers at ₹3,000 are officially trapped. They will start panicking and buying back their shares.
By keeping an eye on stocks trading just above their “Highest Call OI” strike, you can predict exactly where short covering will start.
4. Watch for “Gap Ups”
In the Indian market, global cues often cause stocks to open with a “Gap Up” at 9:15 AM.
If a stock has been in a downtrend and suddenly gaps up above the previous day’s high, it puts every overnight seller at a loss.
The first 15 to 30 minutes of such a day often see an intense short-covering rally as these traders scramble to exit.
5. Check the Delivery Percentage
While short covering is a derivative (F&O) concept, it helps to check the delivery volume. A short covering rally is often characterized by high volume but low delivery percentage.
This proves that the move is driven by intraday traders squaring off their positions rather than long-term investors buying for their portfolios.
Example of Checking Short Covering Stocks
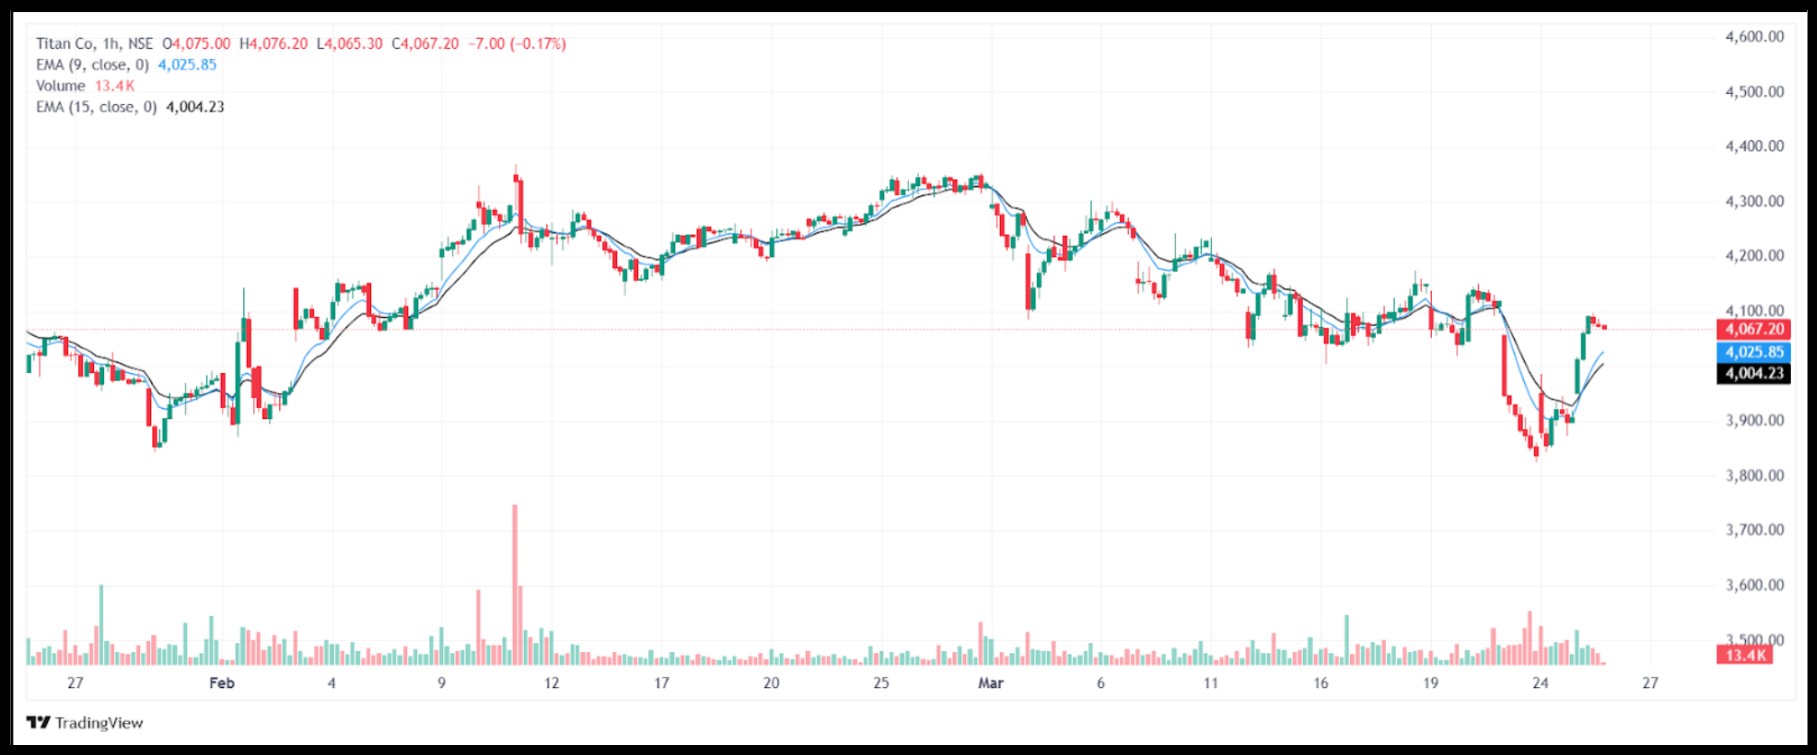
In the chart of Titan Company (1-hour timeframe), a clear example of short covering appears around March 24-25.
After a strong downtrend, the stock suddenly forms a sharp bullish move with long green candles, indicating aggressive buying.
This rise is not gradual; it is fast and vertical, which is a key sign of short covering.
At the same time, the move is supported by a noticeable increase in volume, showing urgency among traders and support at around 3830.
Since the rally starts right after a steep fall, it suggests that sellers who were holding short positions are now under pressure and rushing to exit.
The quick recovery and continuation upward confirm that this is not fresh buying alone, but largely forced buying by trapped sellers, which defines a classic short-covering move.
Tools to Find Short Covering Stocks
You don’t need complex or expensive setups to track short covering. With the right tools, you can quickly identify where sellers are exiting in real time and focus only on high-probability opportunities.
Here are some of the best tools to find short covering stocks:
- Chartink: This is one of the most powerful free tools for custom scanning. You can create your own short covering scanner using conditions like price rising, Open Interest falling, and volume above average. It gives you flexibility to refine results based on your strategy.
- Trendlyne: This platform offers ready-made derivative scans and insights. You can directly access data related to Open Interest changes and identify stocks where short covering activity is happening without building custom filters.
- Dhan ScanX: A modern scanner with pre-built setups for momentum and reversal trades. It helps you quickly find stocks showing signs of short covering with minimal manual effort.
- Upstox F&O Dashboard: Useful for tracking real-time Open Interest, price action, and derivatives data. It provides a clear view of where positions are getting unwound in the market.
Common Mistakes to Avoid Short Covering Traps
Even experienced traders misread short covering because they focus only on price and ignore the underlying data.
Avoid these common mistakes to stay on the right side of the move:
- Confusing It with Fresh Buying: Not every price rise is bullish. If Open Interest is rising along with price, it is not short covering but long build-up. Always check OI data before taking a trade.
- Chasing the Move Too Late: Short covering rallies are fast and sharp. Entering after a big spike increases your risk, as the move may already be near exhaustion.
- Ignoring Resistance Levels: Many short covering rallies slow down or reverse near key resistance zones. Entering just below resistance without confirmation can lead to quick losses.
- Trading Without Volume Confirmation: A price rise without strong volume is often unreliable. Always ensure the move is backed by high participation.
- Not Using a Stop Loss: Short covering moves are highly volatile. Always place a stop loss below the recent swing low or intraday support level to protect your capital.
Conclusion
Knowing how to find short covering stocks gives you a significant edge, especially on expiry days (like the Nifty expiry on Thursday).
The short covering effect on stock price usually results in a move that is much more aggressive than a standard rally.
These moves are often vertical and move much faster than regular rallies.
However, remember that short covering is often a temporary “squeeze.” Once the sellers have finished covering, the price may stop rising or even fall back down.
Therefore, the best strategy is to enter early, capture the momentum, and book your profits quickly.
Keep an eye on the falling OI, stay disciplined, and let the panic of the sellers become your profit!
Take it beyond theory. Join our stock market classes and learn to spot short covering moves as they happen in live markets.
FAQs
Q1: How can I quickly identify short covering stocks during live market hours?
You can identify short covering stocks by monitoring the relationship between price and open interest. If the stock price is rising while open interest is falling, it usually indicates that short sellers are exiting their positions.
Q2: Which indicators help confirm a short covering rally in a stock?
Apart from price rise and falling open interest, traders also watch volume spikes, resistance breakouts, and option chain data. These signals together often confirm that a short covering rally is happening.
Q3: Are short covering stocks suitable for intraday trading?
Yes, short covering stocks are often ideal for intraday trading because the price moves can be fast and sharp. However, traders should act quickly because these rallies may not last for long.
Q4: Why do short covering rallies often happen near resistance levels?
Many traders place short positions near major resistance levels. When the price breaks above that level, their stop-loss orders get triggered, forcing them to buy back their positions and accelerating the rally.
Q5: What should traders do after identifying a short covering stock?
Once a trader identifies short covering, the focus should be on capturing the momentum early and managing risk carefully. Since these rallies are usually temporary, booking profits quickly and using stop losses is important.
Before investing capital, invest your time in learning Stock Market.
Fill in the basic details below and a callback will be arranged for more information: