Have you ever wondered why some market declines turn into powerful downtrends while others quickly recover? The answer often lies in short build up activity.
When traders create fresh short positions while prices fall, it signals growing bearish confidence in the market. This is why understanding how to identify short build up becomes important for traders.
By combining price action with Open Interest analysis, traders can recognize when sellers are strengthening their positions and when the market may be preparing for a deeper correction.
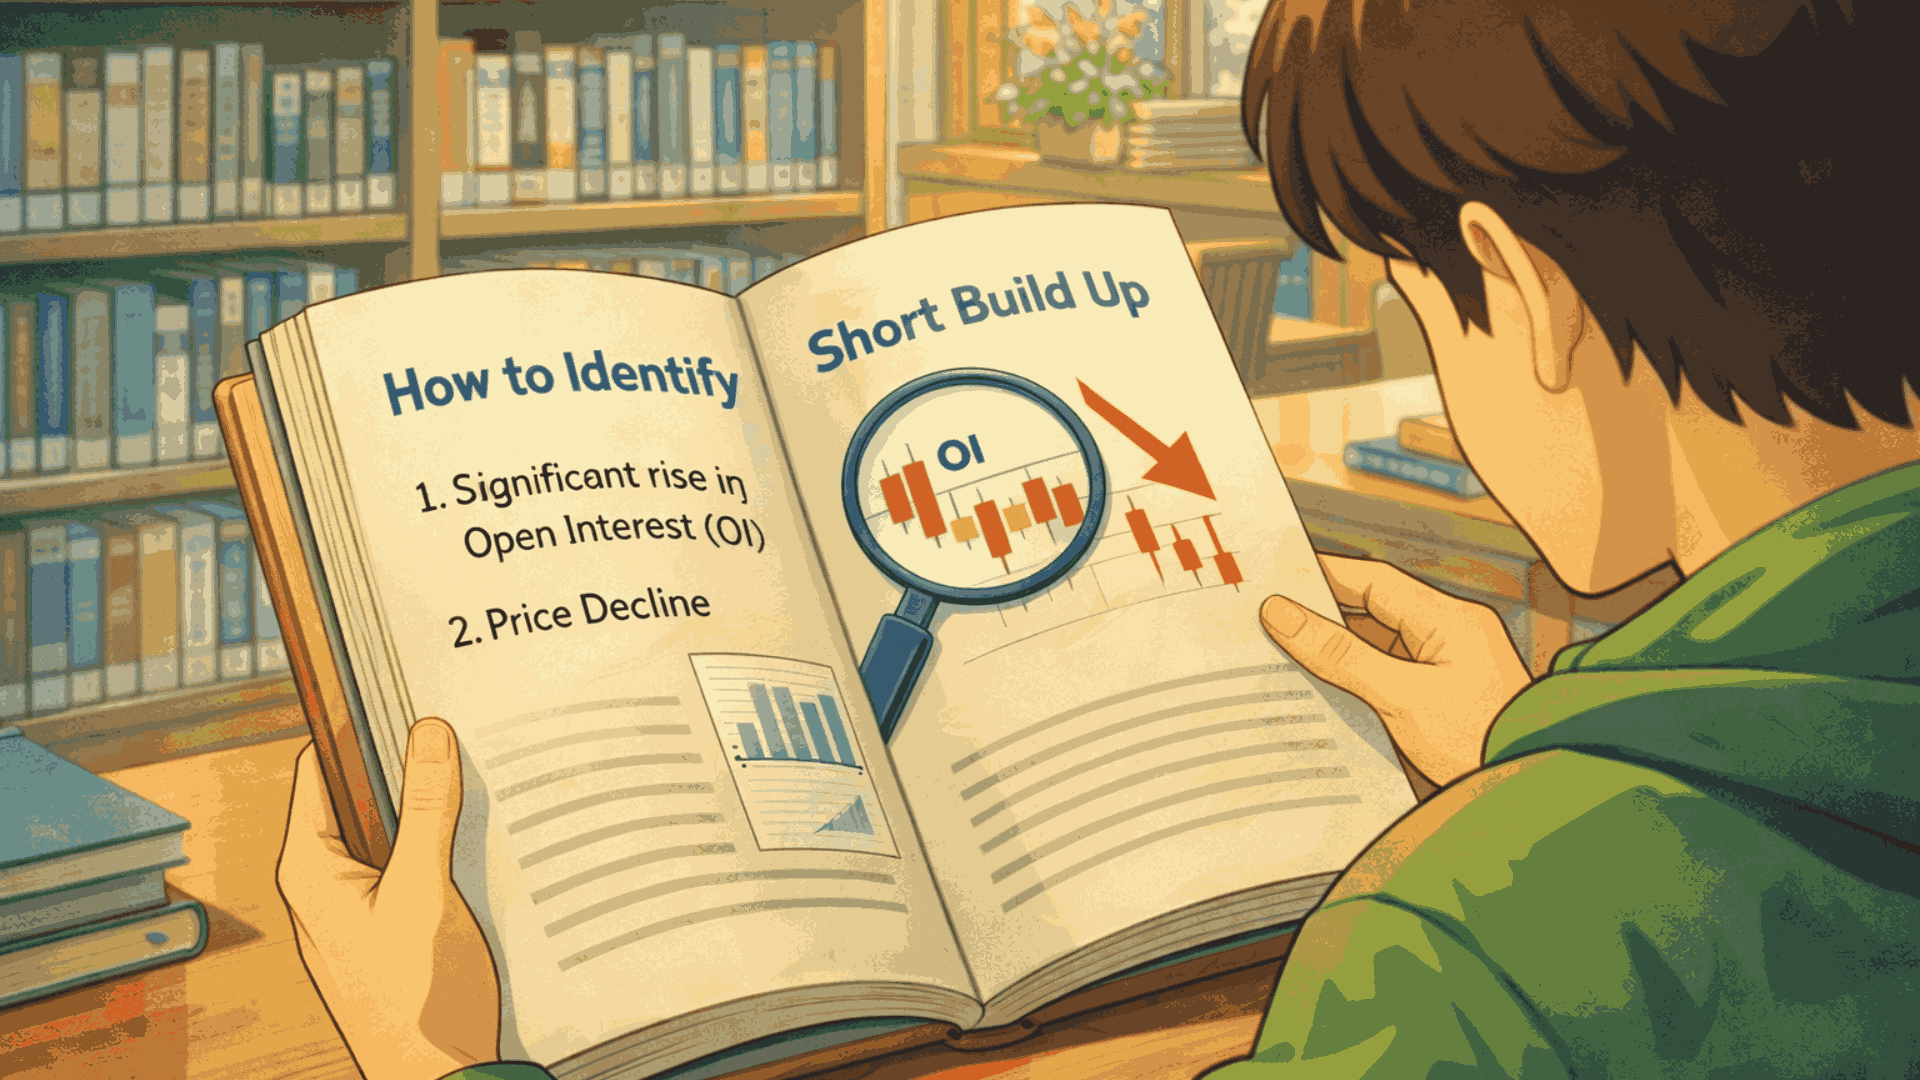
How to Identify Short Build Up in Stocks?
To accurately spot when the bears are taking control, you should look for these eight technical signs.
Each of the following signals gives you a deeper insight into whether real short positions are being built or not.
1. Persistent Fall in Price
A genuine short build up is not just a sharp fall but a controlled and structured decline.
The stock typically shows a steady downtrend with minor pullbacks, and most candles close near their lows, indicating that sellers remain active till the end of each session.
Any intraday bounce is quickly sold into, which reflects continuous supply at higher levels and strong bearish intent.
2. Rising Open Interest (OI)
Rising Open Interest during a price decline confirms that new short positions are being created.
What does Open Interest indicate in this scenario is that fresh money is entering on the sell side, rather than old buyers simply exiting their trades.
When OI increases consistently over multiple sessions or spikes during a breakdown, it indicates strong conviction from institutional traders.
If OI does not rise, the move lacks strength and may not sustain.
3. High Trading Volume
Volume validates whether the selling pressure is meaningful. In a strong short build up, volume expands significantly, especially during breakdowns.
This shows that market participants are accepting lower prices and actively participating in the move.
Consistent high volume across sessions reflects sustained bearish interest, whereas low volume declines often fail due to a lack of commitment.
4. Breakdown of Major Support Levels
Short build up gains momentum when price breaks important support levels, such as previous swing lows or key moving averages.
A strong signal occurs when the stock closes below these levels on higher timeframes and fails to reclaim them.
When broken support turns into resistance on a retest, it confirms that sellers have taken control and are defending lower price zones.
5. Negative Signals from Option Chain
Option chain data helps you understand where large traders are positioning themselves.
Rising Open Interest on the call side at specific strike prices indicates heavy call writing, which acts as resistance.
If the price struggles to move above these levels and call premiums do not rise despite price stability, it reflects a lack of bullish interest and strengthens the bearish outlook.
6. Lower Highs and Lower Lows
A consistent pattern of lower highs and lower lows confirms that the market is in a strong downtrend.
Each attempt to move higher is rejected at a lower level than before, showing that sellers are becoming more aggressive.
This structure indicates that buyers are weak and unable to regain control, which is a classic sign of ongoing short build up.
7. Sectoral Weakness
A short buildup becomes more reliable when it is supported by weakness across the entire sector.
If multiple stocks within the same sector are showing falling prices along with rising Open Interest, it indicates broad-based selling by institutions.
Sector indices trending downward further confirm that the bearish sentiment is not isolated but part of a larger move.
8. Rising Put-Call Ratio (PCR) Resistance
The Put-Call Ratio provides additional confirmation when viewed in context. A gradual increase in call writing compared to put writing creates a resistance zone in the market.
This indicates that traders expect the price to remain below certain levels. When this aligns with falling prices and rising Open Interest, it strengthens the case for a short build up and signals continued downside pressure.
Example of Short Build Up
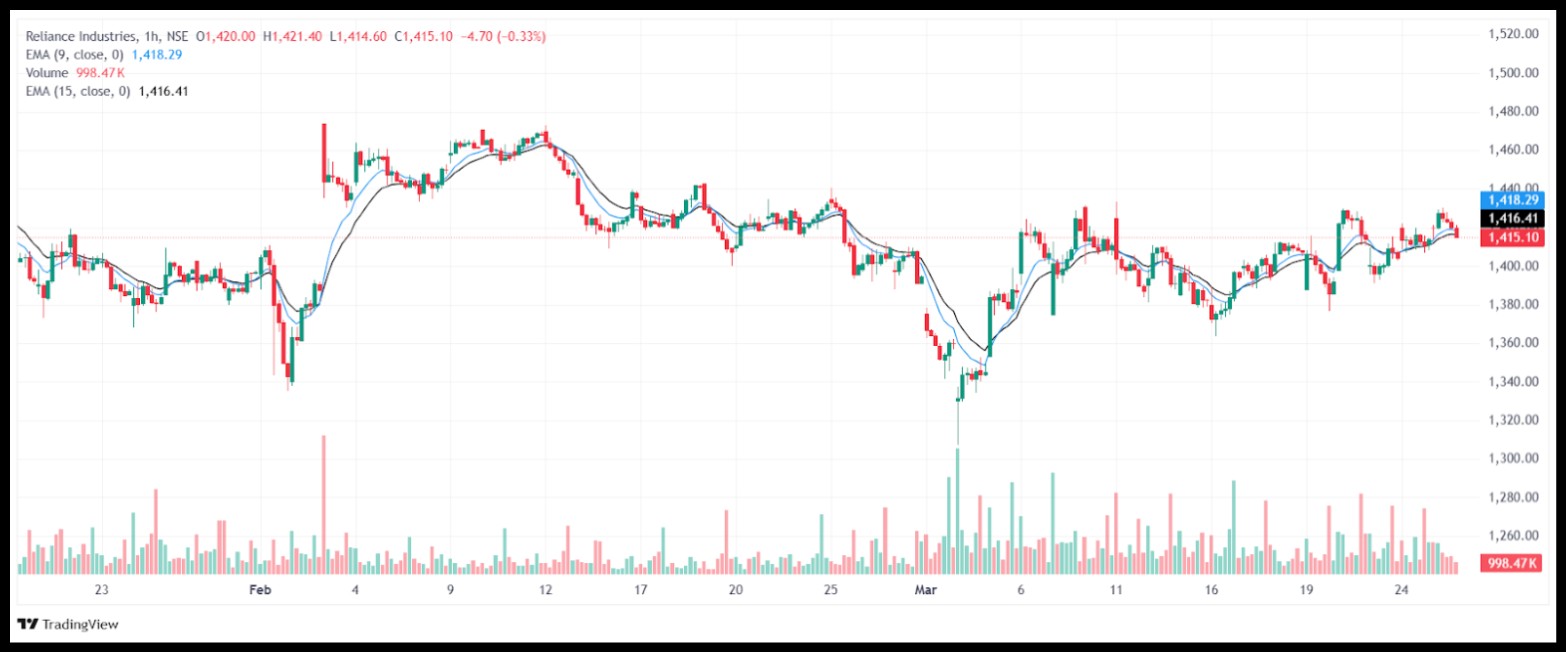
A clear example of short build-up in this chart of Reliance Industries can be seen in the last week of February (around Feb 24–28), where the price falls sharply from near 1,420 to around 1,350 while volume increases significantly.
During this phase, the stock consistently makes lower highs and lower lows, showing sustained weakness rather than a quick dip.
The rising volume along with falling price indicates that traders are actively adding new short positions instead of just exiting long trades.
This combination of declining price, increasing volume, and continued downward structure confirms a classic short build-up, where sellers are confident and expect further downside.
What Does Short Build Up Indicate?
When you successfully identify short build up, it gives you a clear picture of the market’s future direction:
- Strong Bearish Conviction: It indicates that the bears are not just “booking profits” but are actively betting on a further market crash.
- Sustained Downtrend: Since new money is entering the sell side, the downward move is likely to last for several days or weeks.
- Aggressive Selling: It suggests that any small rally will be used by traders as an opportunity to sell more.
Difference Between Short Build Up and Long Build Up
Both represent high conviction, but their directions are opposite:
|
Feature |
Short Build Up | Long Build Up |
| Price Movement | Decreasing (Falling) |
Increasing (Rising) |
|
Open Interest (OI) |
Increasing (New Shorts) | Increasing (New Longs) |
| Market Sentiment | Strongly Bearish |
Strongly Bullish |
|
Participant Action |
Fresh Selling | Fresh Buying |
| Conclusion | The market is likely to fall further |
The market is likely to rise further |
Conclusion
Learning how to identify short build up is a vital skill for anyone trading in the F&O segment. It protects you from “buying the dip” when the market is actually in a free-fall mode.
By watching the relationship between falling prices and rising Open Interest, you can align yourself with the “Smart Money.”
Always remember to use a stop loss, as a sudden “Short Covering” rally can cause prices to spike unexpectedly.
Watch the data, and use these signs to identify short build up early to stay ahead of the market!
If you want to master these skills with real-time market practice, join our option trading classes, where you learn to read Open Interest and price action as it happens.
FAQs
Q1: How can traders identify a short build up in the stock market?
Ans: Traders can identify short build up when the stock price falls while Open Interest (OI) increases. This indicates that new traders are creating fresh short positions and expecting the market to move lower.
Q2: Is a short build up always a bearish signal?
Ans: Yes, a short build-up usually indicates strong bearish sentiment because traders are actively selling with the expectation of further price decline.
However, sudden positive news can trigger short covering and cause a temporary price spike.
Q3: Where can traders check short build up data?
Ans: Traders can track short build-up using F&O data, option chain analysis, and Open Interest reports available on platforms like the NSE website or trading platforms that provide derivative market insights.
Q4: What happens after a short build up in a stock?
Ans: After a short build-up, the market often continues its downtrend because new selling positions have been created.
However, if the price suddenly rises, it may trigger short covering, causing a sharp upward move.
Q5: Can beginners use short build up signals for trading decisions?
Ans: Yes, beginners can use short build-up signals, but they should combine them with technical indicators, support levels, and proper risk management before making trading decisions.
Before investing capital, invest your time in learning Stock Market.
Fill in the basic details below and a callback will be arranged for more information: