Imagine watching a stock fall steadily for hours and then explode upward without a single piece of news to explain it.
That moment of confusion is exactly where most traders make costly mistakes.
They either jump in too late or assume it is a genuine trend reversal and get trapped. What actually drove that move was short covering, one of the most powerful and misunderstood forces in intraday trading.
Knowing how to identify short covering is what separates traders who react to moves from those who anticipate them. It is not about reading charts differently. It is about reading the right data at the right time.
In this blog, we cover every key sign that reveals a short covering rally before it runs out of fuel.
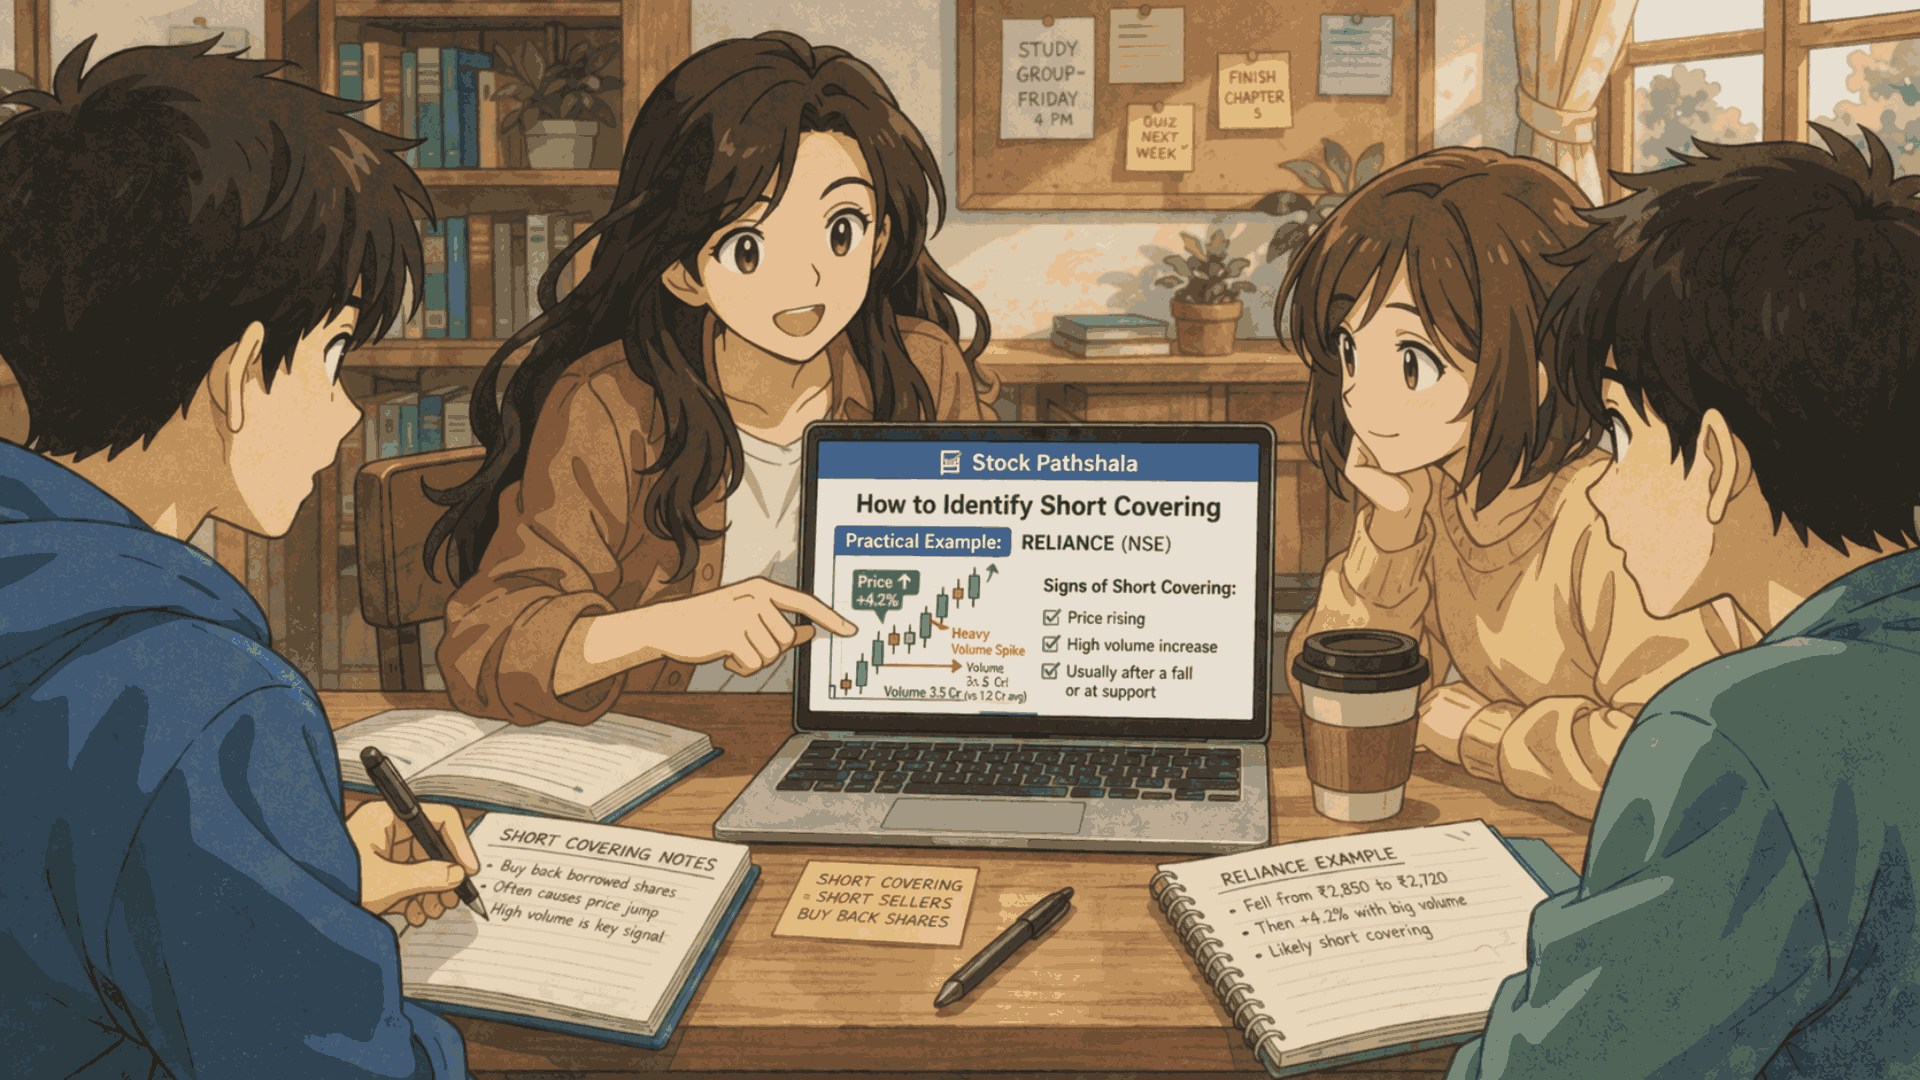
How to Identify Short Covering in Stock Market?
To trade effectively, you need to look beyond the green candles on your screen. Many traders chase sharp moves without understanding what is actually fueling them.
That is exactly when they get caught on the wrong side. The real story always lies in the data behind the move.
Here are seven key signs that help you identify a short covering rally in real time:
- Price Rises While Open Interest Falls
This is the golden rule of every short covering rally. In a healthy bull run, both price and Open Interest rise together. But when the price rises and OI falls simultaneously, short sellers are closing their positions.
Fresh buyers are not driving the move at all.
- Breaking Major Resistance Levels
Short sellers place their stop losses just above key resistance levels. Round numbers like Nifty 24,500 or 25,000 are classic examples of this.
Once price breaks above these levels, a chain reaction of buy orders gets triggered.
Because these sellers must buy shares back to exit, does short covering increase price? Absolutely; this cascade of forced buying creates a sudden demand spike that fuels a sharp rally.
- Sudden Volume Spikes
Organic buying tends to be steady and gradual in nature. Short covering, however, is panicked and explosive by nature.
You will spot a massive volume spike within just 5 to 15 minutes. Sellers are scrambling to exit before their losses get worse.
- Expiry Day Volatility
India has two weekly indices, Nifty 50 and Sensex, every single week. As the clock approaches 2:00 PM or 3:00 PM on expiry day, pressure builds rapidly.
In the money, short sellers must cover their positions before time runs out. This urgency creates the classic expiry day short covering rally.
- Gap Up Against the Trend
When a falling stock suddenly opens with a gap up, overnight shorts get trapped immediately. Their panic to exit at market open creates a sharp short-covering spike.
Global cues often act as the trigger for these gap-up situations.
- Negative News Exhaustion
Sometimes a stock simply refuses to fall despite bad news around it. This signals that all willing sellers have already exited the market.
When the price begins inching upward, remaining shorts start covering out of fear.
- India VIX Cooling Down
Watch the India VIX closely when a short covering rally begins forming. A falling or stabilising VIX means fear among short sellers is reducing.
This reduction in fear often accelerates the covering process significantly.
Not every sharp rally deserves your entry. Some moves are driven by genuine strength, while others are simply forced covering.
Knowing the difference protects you from chasing the wrong trade at the wrong time.
Keep watching the relationship between price, Open Interest, and volume on every move.
These three together will tell you the truth that price alone never will. The more you practice reading these signals, the faster your decision-making becomes.
Short Covering Example
Before looking at the chart, it helps to understand why short covering happens in the first place: it is fundamentally driven by a “loss of conviction” among bears.
As the price drifts higher, short sellers begin to fear that their profit margins are evaporating or, worse, that they are heading into a loss.
This fear forces them to buy back the shares they previously borrowed, which adds a sudden wave of demand to the market that wasn’t there before.
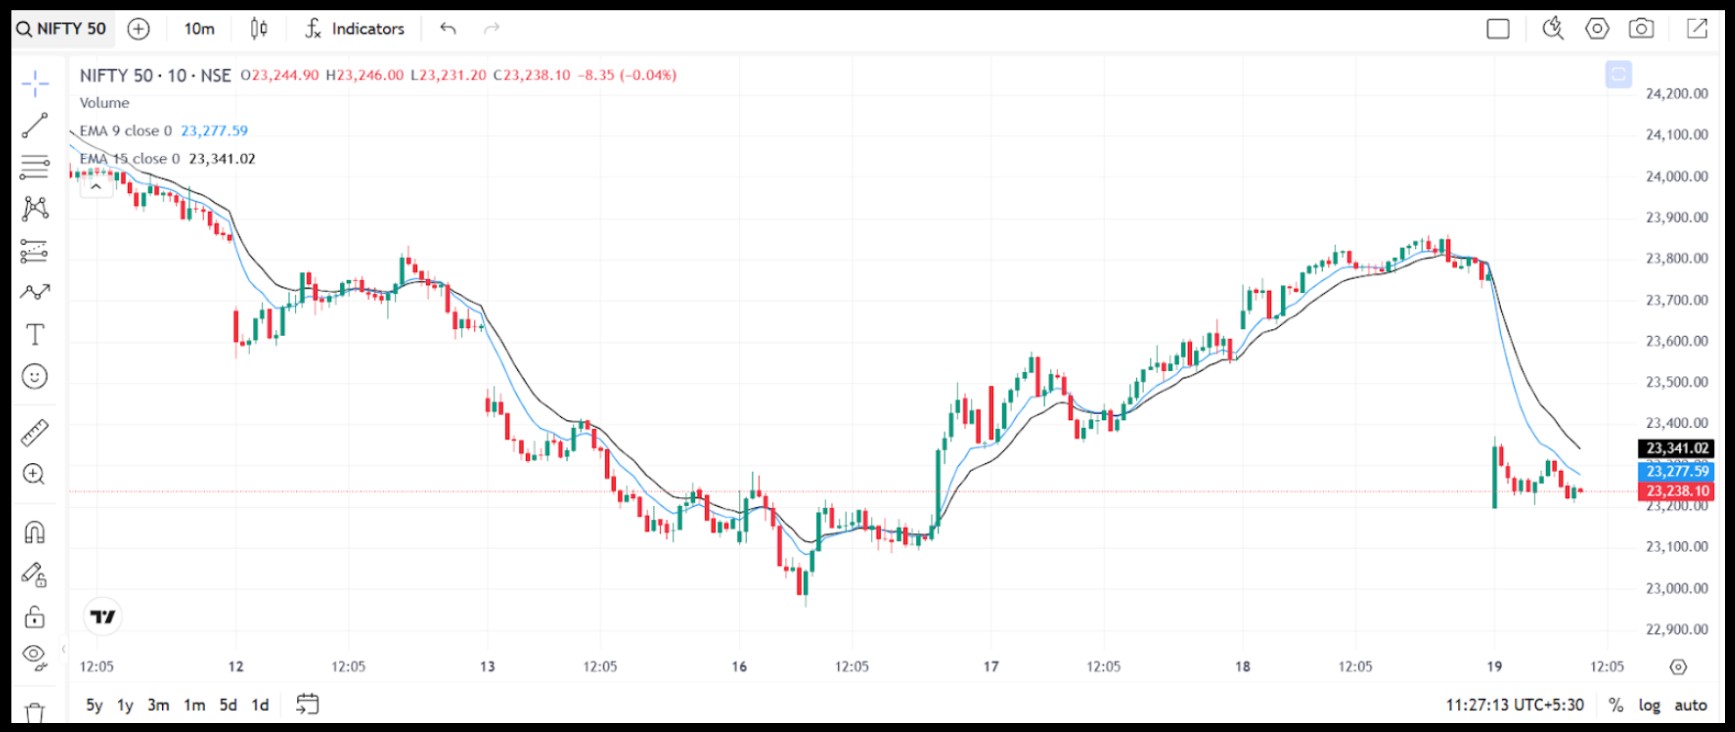
In this Nifty 50 chart, short covering can be identified around the transition from the 16th March to the 17th March.
After a sustained downtrend, the index forms a base and then suddenly rallies with strong bullish candles.
This sharp upward move, without a prolonged accumulation phase, indicates that short sellers are exiting their positions.
The quick momentum and structure break confirm a short covering rally rather than fresh buying.
Short Covering vs Other Market Conditions
Not every price move means the same thing. The table given below shows key market conditions and how to tell them apart instantly.
|
Market Condition |
Price | Open Interest | What It Means |
| Short Covering | Rising | Falling |
Shorts closing positions, forced buying |
|
Fresh Buying |
Rising | Rising | New long positions are being created, with genuine strength |
| Long Unwinding | Falling | Falling |
Longs closing positions, profit booking, or exit |
|
Fresh Shorting |
Falling | Rising |
New short positions are being created, with bearish conviction |
The key takeaway from this table is that price alone tells you nothing. Two completely opposite market conditions, short covering and fresh buying, both show rising prices.
Open Interest is what separates them, so always confirm the OI direction before acting on any sharp move.
Common Mistakes to Avoid While Identifying Short Covering
Even experienced traders misread short covering because they focus on price alone and ignore the underlying data.
These mistakes often lead to chasing false moves or exiting good trades too early.
- Confusing Short Covering with Fresh Buying: A sharp price rise does not automatically mean strength. If Open Interest is rising along with price, it is likely a fresh long build-up, not short covering. Entering a trade, assuming it is short covering, can lead to wrong expectations about how long the move will sustain.
- Ignoring the Pace of OI Change: It is not just about OI falling; it is about how fast it is falling. Gradual OI decline with slow price rise often indicates normal profit booking, not aggressive short covering. Real short covering shows a sharp drop in OI within a short time frame, especially on lower timeframes like 5 or 15 minutes.
- Chasing Moves After the Short Covering is Over: Most short covering rallies are fast and short-lived. By the time a large green candle is visible, a significant part of the move is already done. Entering late exposes you to reversals once the forced buying is exhausted.
- Ignoring Key Resistance Zones: Short covering often gets triggered at resistance, not beyond it. If price is approaching a strong resistance level with falling OI, the move may stall once major shorts are cleared. Blindly buying into resistance without context can trap you at the top.
- Not Checking Futures Data Alongside Options: Many traders rely only on option chain data. However, short covering is more clearly visible in futures OI. Ignoring futures data can give you an incomplete picture and lead to misinterpretation of the move.
- Misreading Volume Spikes: High volume alone does not confirm short covering. It could also be a fresh, long entry. The key is to combine volume with OI. High volume + falling OI supports covering, while high volume + rising OI indicates new positions.
- Overlooking Market Context (Trend & News): A sudden spike during a strong downtrend could be just temporary covering, not a trend reversal. Similarly, moves triggered by news events may not sustain after initial covering. Without context, traders often assume a full reversal and get trapped.
Conclusion
Short covering rallies are fast, sharp, and unforgiving if you are on the wrong side of them.
But when you know what to look for, they become one of the clearest trading opportunities in the market.
Price and Open Interest together reveal what no candle pattern ever can. Layer in volume, VIX, and expiry context, and the picture becomes even sharper.
The goal is not to react to every move but to read it before it fully plays out.
Start applying these signals and watch how differently you begin to see the market.
Take the next step with our option trading classes at Stock Pathshala, where you learn to read these moves with real market clarity.
FAQs
Q1: How can traders identify short covering rally signals?
Ans: Traders can identify short covering rally signals by looking at rising prices along with falling open interest. This combination usually indicates that short sellers are closing their positions, which can trigger a sharp upward move in the market.
Q2: What is the difference between short covering and fresh buying?
Ans: Short covering occurs when existing short positions are closed by buying back shares, while fresh buying happens when new long positions are created. Fresh buying usually increases open interest, while short covering typically reduces it.
Q3: Why does short covering cause sharp price moves?
Ans: Short covering often creates panic buying because traders who bet on falling prices rush to exit their positions. When many traders buy at the same time to close shorts, it can push prices up very quickly.
Q4: Can short covering rallies be traded profitably?
Ans: Yes, traders can benefit from short covering rallies if they identify them early. By understanding price action, volume, and open interest changes, traders can join the momentum instead of being trapped on the wrong side of the trade.
Before investing capital, invest your time in learning Stock Market.
Fill in the basic details below and a callback will be arranged for more information: