Have you ever watched the sea at Marina Beach in Chennai or Juhu Beach in Mumbai? Some waves crash hard, some roll in gently, and sometimes there’s a quiet pause in between. The Indian stock market also works in a similar way. Prices don’t just move straight up or down; they rise and fall in waves. But what’s challenging is how to identify wave patterns.
Learning to spot these waves can give you an edge: you’ll have a clearer idea of when the market might rise, when it may correct, and how to avoid getting caught by surprise.
That’s what Elliott Wave Theory is about.
What are the Most Common Wave Patterns?
What’s a simpler way to identify a wave pattern is to think of the market like a dance: two steps forward, one step back. Elliott Wave Theory says this dance happens in two types of waves:
1. Impulse Waves
Impulsive waves indicate a trend. This Impulse wave pattern consists of strong moves in the direction of the main trend, usually broken into five parts:
- Wave 1 – The first move up. Quiet, often ignored.
- Wave 2 – A pullback, like the market taking a breath.
- Wave 3 – The biggest surge, often 1.6x the size of Wave 1. Everyone notices.
- Wave 4 – A pause or sideways movement.
- Wave 5 – The final push, when excitement is at its peak and media/social media are buzzing.
This is when you’ll hear even non-investors asking, “Should I buy Reliance? HDFC Bank? Infosys?”
2. Corrective Waves
As the name suggests, it indicates pullbacks. After five upward waves, the market usually corrects in three steps:
- Wave A – The first drop, worry starts.
- Wave B – A bounce, giving false hope.
- Wave C – The deeper fall, when fear dominates and weak hands exit.
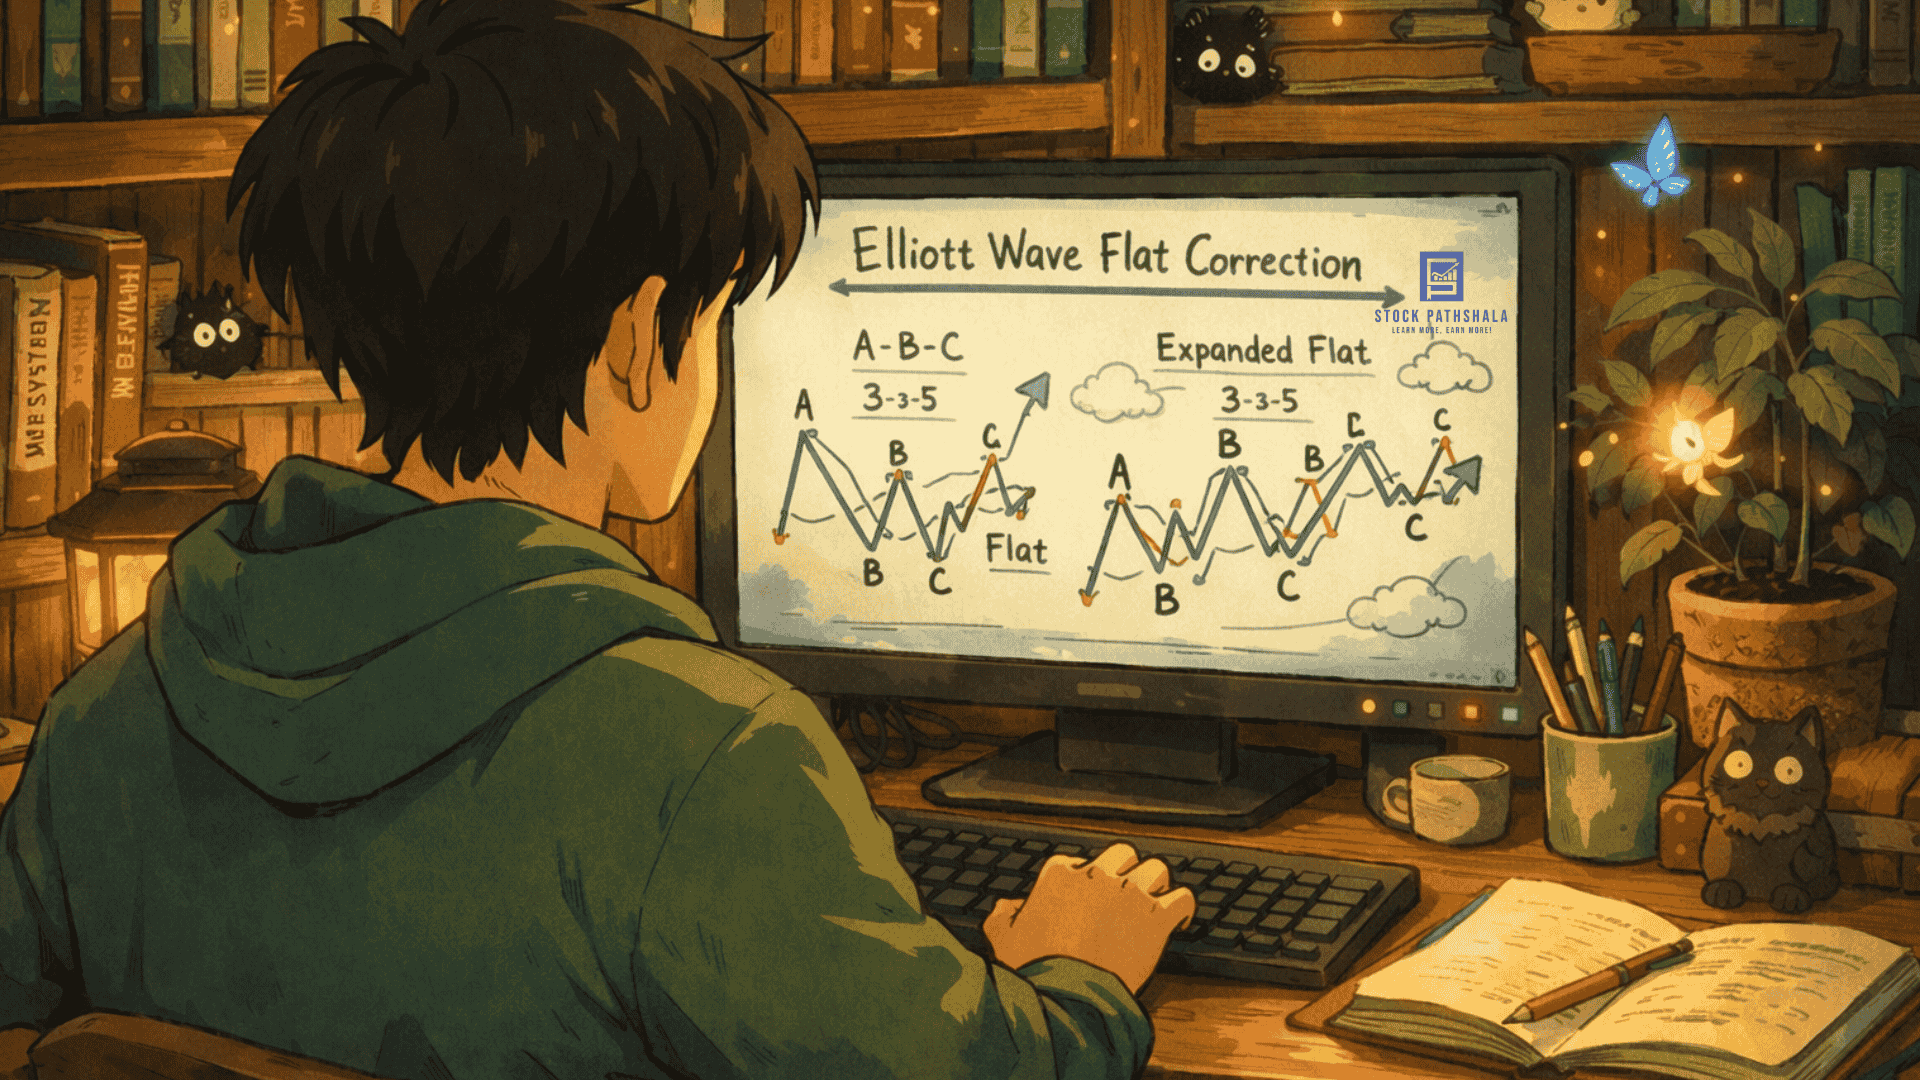
While some corrections are sharp, others are sideways and deceptive, often forming an Elliott Wave Flat Correction where the market moves mostly horizontally rather than crashing straight down.
Corrections often retrace 38% to 61.8% of the previous uptrend, which is why traders use Fibonacci levels.
For better marking and using analysis on the chart, it is essential to understand impulsive vs corrective wave.
A Real Example from Indian Markets
So, how to identify a wave pattern? For this, let’s take the example ofthe NIFTY cycle between 2020 and 2022:
- Wave 1 – After the COVID crash in March 2020, markets bounced strongly by April–May.
- Wave 2 – Small pullback in mid-2020.
- Wave 3 – A huge rally followed: NIFTY surged from ~7,500 to 18,000 by late 2021. Stocks like Tata Steel, Infosys, and Bajaj Finance shot up massively.
- Wave 4 – Sideways moves in late 2021 as valuations felt stretched.
- Wave 5 – Final push to a new peak in October 2021 (~18,600). The media was full of “India’s growth story” headlines.
Then came the correction in 2022:
- Wave A – Fall to ~15,200 by June as inflation and global rate hikes spooked markets.
- Wave B – Bounce back to ~18,000 in August, giving hope.
- Wave C – Another dip by September–October, before stabilizing.
This was a textbook Elliott Wave cycle playing out in Indian equities.
How to Spot a Wave Pattern?
Now in the current market, which wave are you actually looking at? For this, it is important to check other parameters like:
- Volume tells a story – Strong moves with heavy volumes usually mean impulse waves. Weak bounces on low volumes often mean corrections.
- Investor behavior – Wave 3 is full of confidence. By Wave 5, enthusiasm is loud but weaker.
- The news test – In a strong uptrend, markets ignore bad news. Near a correction, even small negative headlines cause panic.
- Technical tools – Fibonacci retracements, moving averages, and RSI help confirm wave stages. Using Elliott Wave with Fibonacci allows you to measure exactly how deep a correction might go, usually retracing 38% to 61.8% of the previous move.
Identifying the completion of a 5-wave move alongside these tools can reveal a clear Elliott Wave reversal pattern, signaling that the trend is about to flip.
For example, when RSI crosses 70 during a Wave 3 move, it signals strong momentum but also warns of a coming correction.
Why is Identifying Wave Patterns Important?
You don’t need to be a full-time trader to use Elliott Wave ideas. Even long-term investors can benefit. Here’s how:
- Avoid buying at the top of Wave 5, when hype is maximum.
- Avoid panic-selling at the bottom of Wave C, when fear dominates.
- Solves the mystery of how to identify market correction and gives you time for healthy resets, not disasters.
That’s why many smart Indian investors combine Elliott Wave analysis with fundamentals—looking at earnings, valuations, and economic data—to judge whether the market is overheated or simply cooling off.
Final Thought
- Elliott Waves don’t guarantee exact predictions, but they give you a framework to understand market rhythm. For Indian investors, spotting these waves can mean the difference between buying into hype and investing with timing and confidence.
Before investing capital, invest your time in learning Stock Market.
Fill in the basic details below and a callback will be arranged for more information: