Every time a stock surges, retail traders celebrate. But are they reading it right?
A rising price can mean two completely opposite things, and confusing them can destroy your trade. The real question is never how much it moved, but why it moved.
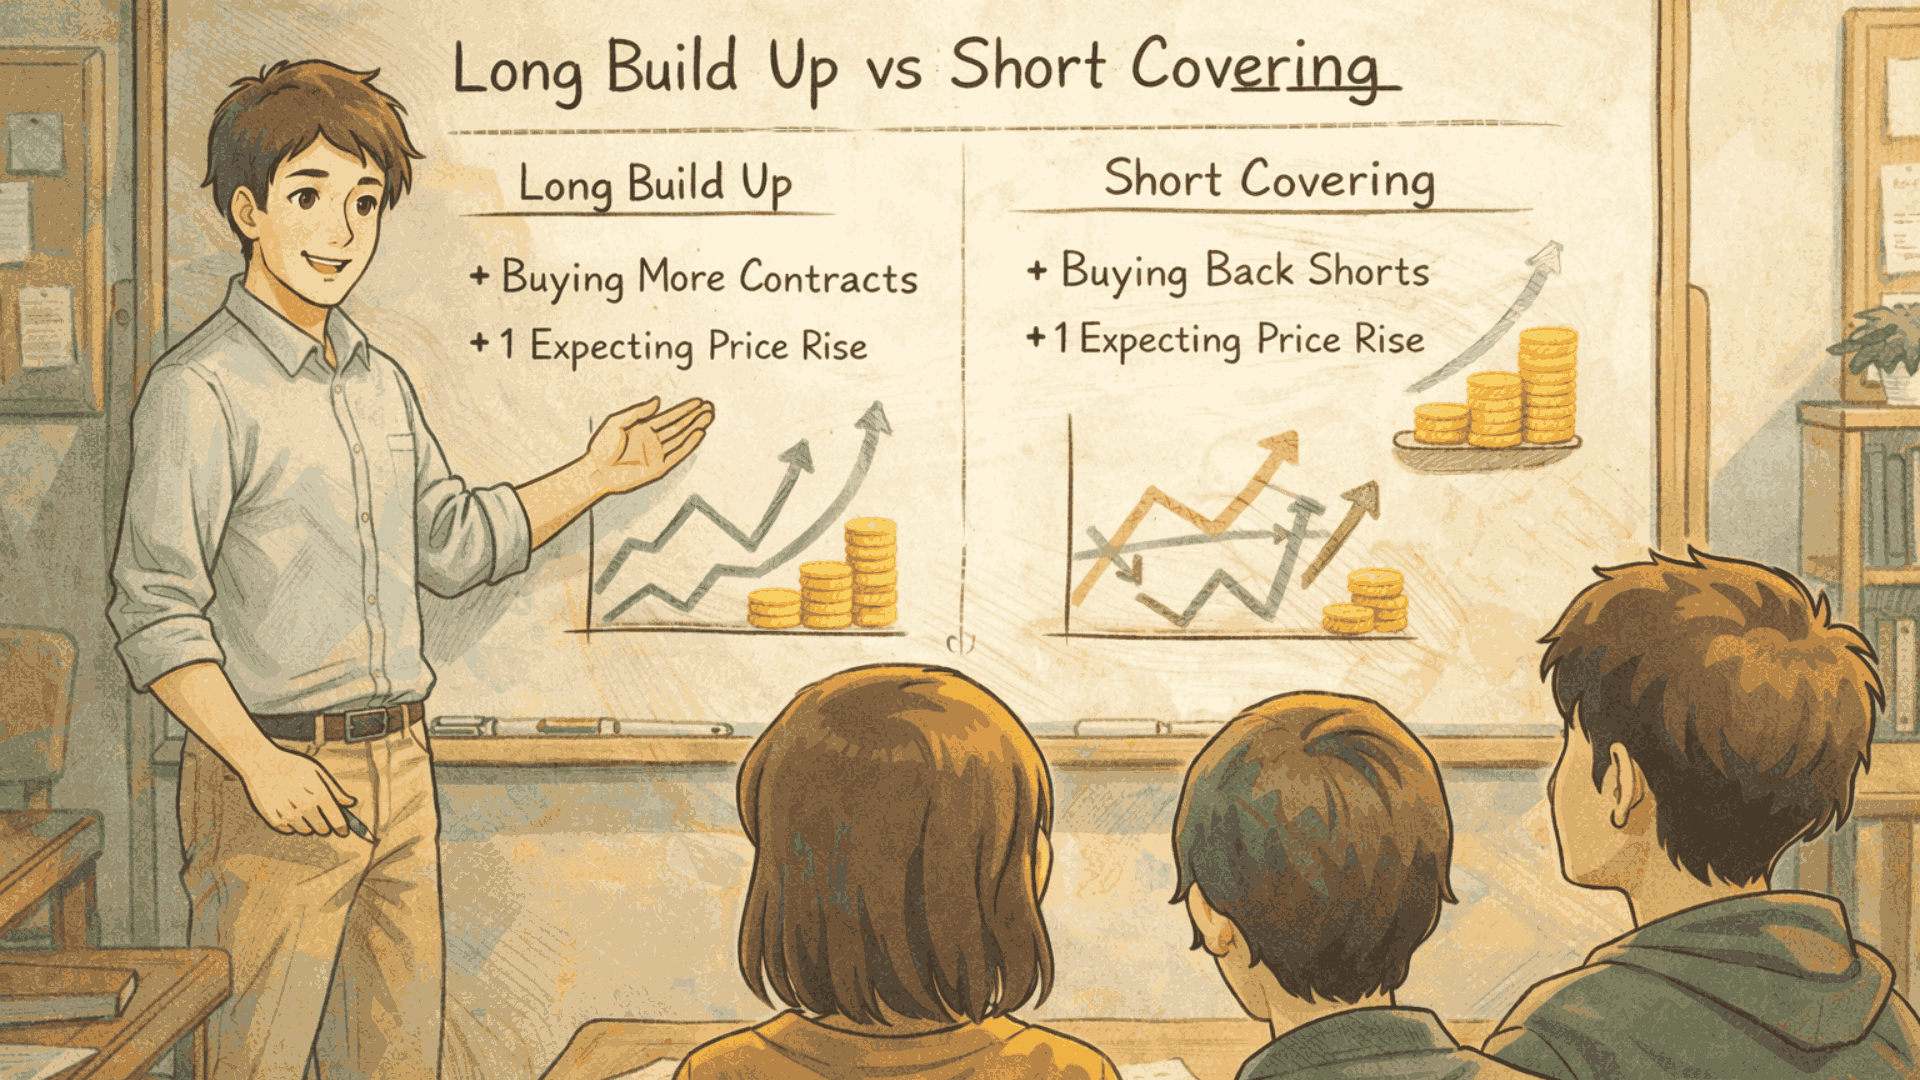
This is exactly where long build up vs short covering becomes the most critical distinction in derivatives trading. One signals fresh bulls charging in with conviction.
The other is just scared bears running for the exit. Both push prices up, but only one actually sustains the move.
If you have ever bought a breakout only to watch it collapse minutes later, you have likely mistaken short covering for a long build up.
This blog will help you understand the difference between Long Build Up and Short Covering, so you never get confused.
What is Long Build Up And Short Covering?
To master long build up vs short covering, you first need to understand Open Interest (OI). It is the total number of derivative contracts in futures or options that remain unsettled.
When OI rises, new money is entering. When OI falls, participants are exiting.
Here is the critical insight: price movement without OI context is noise. Price movement with OI context is a signal.
Think of it this way. A crowd outside a stadium could be arriving or leaving. Open Interest tells you which direction they are moving.
Long build up and short covering both produce the same surface outcome, a rising price. But the story beneath each is completely different, and that difference defines your trade.
What Does Long Build Up Mean?
Long build up occurs when rising prices are accompanied by rising Open Interest. This tells you one definitive thing: new buyers are actively entering the market with fresh capital and real conviction.
The market is not moving up because someone exited. It is moving up because someone entered.
- Price climbs as buyers accumulate at progressively higher levels
- OI rises in tandem, confirming new contracts are being created
- Volume is steady and consistent, not erratic
- Institutional participation is often visible through large OI additions
Practical Example of Long Build Up
Consider Reliance Industries consolidating below ₹2,850 resistance. It suddenly breaks out to ₹2,910 on three times the average volume, with OI jumping 18% in a single session.
This is a textbook long build up. A price chart shows a breakout. OI data reveals conviction-driven institutional buying, an entirely more reliable setup.
What Does Short Covering Mean?
Short covering occurs when rising prices are accompanied by falling Open Interest. The buyers pushing the price up are not new entrants.
They are existing short sellers buying back contracts to close losing positions.
When enough short sellers exit simultaneously, collective buying lifts the price rapidly, but artificially.
- Price rises sharply and vertically
- OI falls as short contracts are closed
- Volume spikes suddenly, then drops fast
- No new capital enters; existing capital is simply repositioned
Practical Example of Short Covering
A mid-cap IT stock falls from ₹1,200 to ₹920 over six weeks. A brokerage upgrade triggers a 5% jump to ₹980. Impressive on the chart. But OI drops 22% during the session.
This is short covering. Short sellers rushed to exit before the weekend, not investors buying value. Once covering exhausted itself, the stock drifted back to ₹940.
The chart showed a green candle. The OI showed an exit, not an entry. That single distinction saves traders from painful mistakes.
Difference Between Long Build Up and Short Covering
The difference between Long Build Up and Short Covering lies in the intent behind the price rise.
While both push prices higher, a long build up shows fresh buying and strong bullish conviction.
Whereas short covering reflects traders exiting bearish positions, leading to a temporary spike rather than a sustained trend.
|
Basis |
Long Build Up | Short Covering |
| Definition | Fresh buying with new long positions being created |
Closing of existing short positions by buying back |
|
Price Movement |
Price increases | Price increases |
| Open Interest (OI) | Increases (new positions added) |
Decreases (positions are closed) |
|
Market Sentiment |
Strong bullish sentiment | Temporary bullish sentiment |
| Trader Intent | Confidence in further upside |
Fear or profit booking by short sellers |
|
Strength of Move |
Strong and sustainable | Sharp but often short-lived |
| Volume Behavior | Supported by consistent buying volume |
Sudden spike in volume |
|
Who is Active? |
New buyers (bulls) entering | Short sellers exiting (bears buying) |
| Trend Impact | Can start or continue an uptrend |
Usually causes a temporary rally |
|
Risk Level |
Relatively lower (trend-supported) | Higher (can reverse quickly) |
| Best Trading Approach | Trend-following strategies (buy on dips) |
Quick trades (scalping or short-term) |
|
Typical Scenario |
Breakout with rising OI | Sharp bounce after a downtrend |
| Example Behavior | Stock breaks resistance and keeps rising |
Stock falls, then suddenly spikes up fast |
The table above makes it clear that while both scenarios produce green candles on your chart, they are fundamentally different market events requiring completely different responses.
In a Long Build Up, you are witnessing the early stages of a potentially powerful trend. The right move is to align yourself with it, manage your risk intelligently, and let the position run.
In Short Covering, you are watching a temporary mechanical event.
The right move is to either participate briefly with a fast exit strategy or to patiently wait for the covering to complete so you can re-enter on the correct side of the trade.
Impact of Long Build Up vs Short Covering
The impact of long build up vs short covering on the future trajectory of a stock is significant. When a long build up occurs, it creates a potential support zone for the stock.
Because new buyers have entered at higher prices, they are likely to defend those levels as long as their bullish conviction remains intact.
However, this support is conditional; if sentiment deteriorates and these longs begin unwinding their positions, that support can dissolve quickly.
Always monitor OI in subsequent sessions to confirm that the long build up is being sustained.
Conversely, the impact of short covering is often short-lived. Since the price rise is caused by sellers exiting their positions, once the majority of shorts have finished covering, the primary buying force weakens significantly.
In practice, short covering often attracts momentum traders and retail participants who pile in after seeing the sharp move.
However, unless fresh long positions begin entering, confirmed by rising OI after the initial spike, this secondary buying typically fades, and the stock either consolidates or drifts back down.
In the debate of long build up vs short covering, the former is the engine of a long-term bull market, while the latter is often a “relief rally” in a broader bear market.
Market Psychology of Long Build Up vs Short Covering
The psychological battle in long build up vs short covering is fascinating. In a long build up, the buyers are in a position of power. They are proactive and optimistic.
They are building a “house” contract by contract.
In short covering, the “buyers” are actually scared bears. They are not buying because they like the stock; they are buying because they have to.
When short covering becomes extreme and accelerated, it can escalate into what is called a ‘Short Squeeze’; these are related but distinct concepts.
Short covering is the routine act of closing a short position to book profit or limit loss.
A short squeeze is a specific, high-intensity event where a rapid price rise triggers simultaneous forced exits by a large number of short sellers, often due to margin calls.
The panic buying in a short squeeze creates a near-vertical price spike that can be far more violent than ordinary short covering. This panic creates a spike.
Understanding the shift between long build up vs short covering allows a trader to sense when the market is moving out of “panic mode” and into “accumulation mode.”
Conclusion
Distinguishing between long build up vs short covering is an essential skill for derivative traders.
Price action tells you what is happening, but the Open Interest tells you why it is happening.
A long build up is a sign of structural strength and fresh bullish conviction, whereas short covering is a sign of temporary volatility and position liquidation.
By integrating the difference between long build up vs short covering into your technical analysis, you can filter out weak rallies and focus on high-probability trades.
Always remember to check the OI change alongside the price.
If the OI is rising with the price, the bulls are building a foundation. If the OI is falling, the bears are simply running for cover. Trade with the build up, and be cautious with the covering!
Stop guessing why the market is rising. Learn to read Open Interest with confidence in our stock market classes.
FAQs
Q1: What is the main difference between long build up and short covering?
Ans: The key difference lies in the Open Interest behavior. In a long build up, both price and Open Interest rise, showing fresh buying interest. In short covering, price rises but Open Interest falls, indicating sellers are closing positions rather than new buyers entering the market.
Q2: Can long build up and short covering happen simultaneously in the same stock?
Ans: Not in the same instrument at the same time, but in options, long build up in call option can occur while short covering in put option happens simultaneously, creating mixed signals. Always analyze OI across both calls and puts before concluding.
Q3: How do I identify long build up vs short covering in real time?
Ans: Watch two things together: price movement and OI change on your broker terminal or NSE data. If price rises and OI rises, it is a long build up. If the price rises but OI drops, it is short covering. Adding volume confirmation makes the signal significantly stronger.
Q4: Is short covering always a bearish signal after the rally ends?
Ans: Not always, but mostly yes. If, after the short covering rally, fresh long build up begins, the trend can genuinely reverse bullish. However, if OI stays flat or continues falling after the spike, the stock will likely resume its downtrend.
Before investing capital, invest your time in learning Stock Market.
Fill in the basic details below and a callback will be arranged for more information: