What if you could trade Nifty intraday without a single indicator and still make faster, smarter decisions than most traders in the room?
The Indian stock market can shift within minutes. When the India VIX spikes, volatility creates rapid price swings that catch most traders off guard.
The ones who struggle most are those relying on lagging indicators like RSI or MACD. By the time those signals fire, the move has already happened.
A Nifty intraday trading strategy without indicators cuts out that delay entirely.
Instead of waiting for a line to cross, you read the price directly through its movement, key levels, and volume. You stay in sync with the market rather than one step behind it.
This blog walks you through a practical, no-indicator approach to Nifty intraday trading that works especially well when markets are moving fast.
Can You Trade Nifty Intraday Trading Without Indicator?
Yes, you can trade Nifty intraday without any indicators.
Different traders prefer varying strategies, mainly on price movements and levels of significance directly related to the underlying market.
In addition, recent changes in the trading environment have resulted in many traders turning to direct price action analyses as opposed to indicator-based systems.
The Securities Transaction Tax (STT) changes were announced by Finance Minister Nirmala Sitharaman in the Union Budget for FY25.
All of these changes have marginally raised the cost of trading:
- Futures STT increased to 0.02%.
- Options STT increased to 0.1% on premiums.
As a result, many traders have gone from trading many small trades to fewer but higher-quality trades.
Price Action Strategy in Nifty Intraday Trading
Price action is a way of trading where you focus directly on how the price moves on the chart instead of depending on indicators.
Traders pay attention to important levels like support and resistance to understand where the market might react.
By observing these price movements, they try to identify possible buying or selling opportunities.
This approach is commonly used in intraday trading because it reflects the market’s behaviour in real time.
This is why many who start with nifty intraday with technical analysis often move toward pure price action to remove the clutter from their screens.
Traders utilize price action trading to examine the price movement of an asset and its market’s structure rather than to use only technical indicators to assist them in their trading.
Traders also look at price action around key levels, such as support and resistance levels and breakout areas, instead of simply waiting for an engineered signal to tell them what the market is going to do next.
Why Traders Prefer Price Action for Nifty Intraday Trading?
Price action focuses on the most direct information available in the market:
- Key price levels
- Market structure
- Volume behaviour
According to market data from India’s National Stock Exchange, the NIFTY 50 index experienced a near 1,700+ point volatility over three trading days in 2026.
Traders who trade based on price movement will often react faster to fast-moving markets than traders who wait for indicator confirmations before making their trades.
How to Implement Price Action Strategy for Nifty Intraday Trading?
Price action strategies rely on observation and patience.
Instead of reacting instantly to every price movement, traders wait for clear levels and structured setups.
Step 1: Understand the Market Context Before the Opening Bell
Get a better view of the entire market before it opens at 9:15 AM.
View your chart on a 15-minute timeframe, then draw two significant levels from the previous day’s trading activity.
- The previous day’s high (PDH)
- The previous day’s low (PDL)
These two levels typically serve as major supporting and resisting forces for the new day’s trading session.
As you learn nifty trading, you will realize that these zones often dictate the bias for the early morning session.
In addition, many traders are watching the GIFT Nifty to help them gain insight into overnight global sentiment. In recent months, the Nifty has often opened significantly higher or lower than the previous day’s close.
This move can sometimes be as large as 80 to 100 points, mainly due to changes in global stock markets.
Step 2: Identify the Opening Range
The first few minutes after the market opens can be volatile. Instead of trading immediately, many traders observe the market during the first 15 minutes.
Watch the price movement between 9:15 AM and 9:30 AM.
Then mark two levels:
- High of the first 15-minute candle
- Low of the first 15-minute candle
This forms the Opening Range (OR), which often becomes an important reference level for the rest of the session.
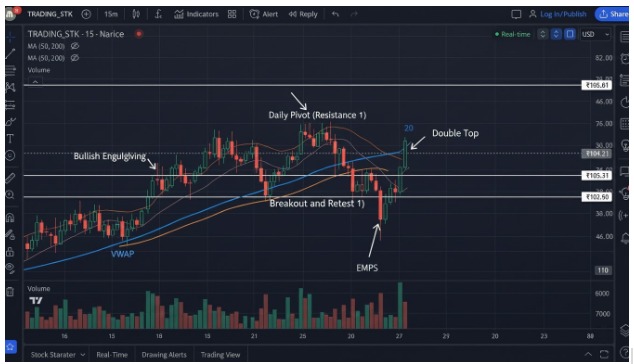
Step 3: Trade the Opening Range Breakout
Once the opening range is defined, traders wait for a breakout.
Bullish Setup
- Price breaks above the opening range high.
- A candle closes clearly above that level.
Bearish Setup
- Price breaks below the opening range low.
- A candle closes that level below.
Volume Confirmation
Instead of focusing on raw volume numbers, traders look for relative volume, a noticeable increase compared to recent candles.
A sudden volume surge often signals stronger participation in the breakout.
Step 4: Managing Risk and Setting Targets
Risk control is essential for intraday trading.
Stop Loss Placement
Traders usually place a stop loss at:
- The midpoint of the breakout candle, or
- The boundary of the opening range
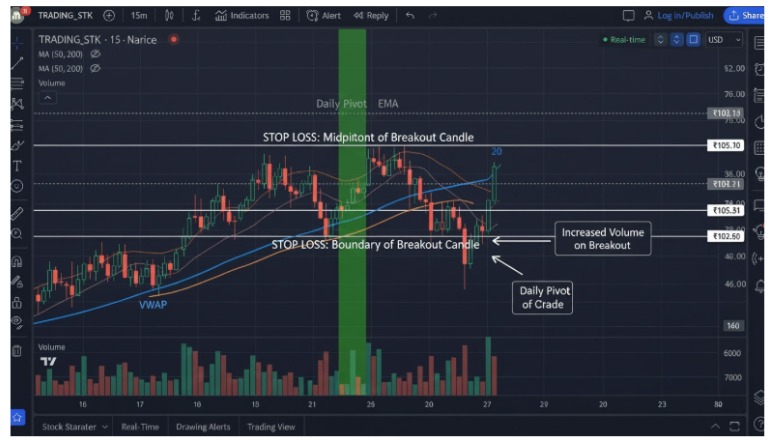
Profit Targets
A common method is using a 1:2 risk-reward ratio.
Example:
- Risk: 25 points
- Target: 50 points
Some traders also watch psychological levels, such as 25,000 and 25,500. These levels often attract strong market reactions.
The Liquidity Sweep Pattern in Nifty Price Action
As traders gain experience, they begin to notice patterns that appear before strong reversals. One such pattern is the liquidity sweep.
Large institutional traders sometimes push prices slightly beyond obvious support or resistance levels.
This move can trigger stop losses placed by retail traders.
Once those stops are triggered, the price may quickly reverse.
How to Spot a Liquidity Sweep?
- Price briefly breaks a known support level below
- The candle quickly rejects the low.
- The candle closes back inside the previous range with a long lower wick.
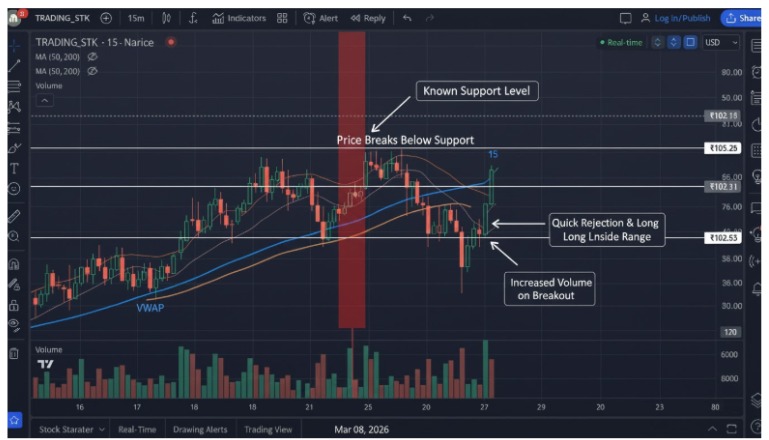
This rejection often appears as a hammer or pin-bar candle. After such a rejection, traders may look for a potential reversal opportunity.
Risk Management Rules for Nifty Intraday Trading
Discipline plays a major role in trading consistency.
1. The 1% Risk Rule
Never risk more than 1% of your trading capital on a single trade.
Example:
If your capital is ₹1,00,000, the maximum risk per trade should ideally remain around ₹1,000.
2. Adjust Position Size During High Volatility
India VIX, published by the NSE, measures expected 30-day market volatility. There is no official NSE or SEBI threshold that defines when traders must reduce position size.
Thus, this remains a personal risk management decision.
Generally, when VIX rises significantly above its recent average, traders choose to reduce exposure and trade more selectively
Price Action vs Indicators in Intraday Trading
These two approaches can work for Nifty intraday trading, but they differ significantly in how they respond to the market.
Understanding these differences can help you choose the right approach for your trading style:
| Feature | Indicator-Based Strategy | Price Action Strategy |
| Response Time | Signals appear after calculations | Traders respond directly to price movement |
| Market Behaviour | Works better in stable trends | Adapts quickly in volatile markets |
| Trading Frequency | Often leads to frequent trades | Focuses on selective setups |
| Learning Curve | Easier initially | Requires observation and practice |
Both approaches can work, but many traders prefer price action because it focuses directly on how the market behaves.
Conclusion
Trading Nifty intraday without indicators does not mean predicting every move. It means reading prices clearly, reacting to key levels, and staying disciplined when the market gets noisy.
That is what separates consistent traders from the rest
By focusing on how price and volume move and developing a proper risk management plan, traders can understand the market more clearly.
This approach creates a more systematic and disciplined way to trade Nifty intraday.
At Stock Pathshala, we aim to provide you with practical skills that you can use to trade successfully in live market conditions.
If you want to develop your Nifty intraday trading strategy properly, the best place to start is by learning a structured approach to price action & building a proper risk management plan.
Over time, experience gained from observing price behaviour will help you refine your strategy.
By using the right methodology to intraday trade Nifty, you can create an intraday trading process that is more disciplined and structured.
So, are you ready to master the markets?
Enroll in our classes on the stock market and gain professional price action strategies from the experts.
Frequently Asked Questions
Q1: Can I trade the Nifty intraday without using indicators?
Ans: Yes, you can. There are many traders who will utilize price action-type strategies rather than traditional technical indicators. These types of trading strategies focus on support and resistance levels as well as volume.
It determines shifts in supply and demand for Nifty futures contracts.
Q2: What time frame should be used when trading Nifty intraday?
Ans: Most intraday traders will use multiple time frames in the same study.
Traders will typically use the 15-minute chart to locate significant price levels. However, 1-minute or 5-minute charts will typically be used for entering trades.
Q3: Is price action better than indicators for intraday trading?
Ans: Price action gives immediate feedback on the market’s movements, while technical indicators provide feedback based on processed information over the past.
Due to this fact, many traders prefer to use price action when trading in a volatile market.
Before investing capital, invest your time in learning Stock Market.
Fill in the basic details below and a callback will be arranged for more information: