Intraday trading in the Nifty 50 is one of the most common ways traders participate in the Indian stock market.
Many beginners who want to learn Nifty trading start by understanding how technical analysis works in intraday markets.
Since the index tracks 50 of the largest companies listed on the National Stock Exchange, it offers strong liquidity and enough daily price movement to create real opportunities, sometimes multiple times in a single session.
For most beginners, though, the challenge isn’t finding the market. It’s figuring out how to trade it consistently. Some rely on tips and others keep switching between indicators, searching for a combination that finally clicks.
Neither approach lasts; tips can’t be tested, and too many indicators create confusion rather than clarity.
In fact, some of the most consistent traders prefer a nifty intraday trading strategy without indicator to keep their decision-making sharp and focused on raw price data.
Technical analysis cuts through that noise. Instead of guessing where the market might go, it gives you a structured way to study what price is actually doing right now and make decisions based on that.
This guide covers how to apply technical analysis to Nifty intraday trading, the methods traders use, how each one works, and how to turn chart observations into actual trade decisions.
What is Technical Analysis in Nifty Intraday Trading?
Technical analysis is the study of price movement, chart patterns, and trading volume to understand how the market is behaving at any given moment.
In an intraday context, the goal isn’t to predict the market perfectly. It’s to identify situations where the probability of a move in a particular direction is high enough to justify the risk you’re taking.
Over time, that edge, applied consistently, is what separates traders who improve from those who don’t.
When traders analyse Nifty 50 charts, they typically focus on three core elements:
- Price action: what the candles and price structure are showing.
- Market trend: the direction the market is moving in.
- Momentum and indicators: the strength and speed behind price moves.
Each element gives you a different perspective on the market. Used together, they help you build a structured, repeatable approach to intraday trades rather than reacting to every price tick.
Pre-Market Preparations for Nifty Intraday
Before you open your Nifty Chart, you have to do a pre-market analysis.
Here are some of the mandatory analyses and preparations you must follow.
- Check GIFT Nifty (formerly SGX Nifty) before the market opens. It trades before the Indian market opens. Also, it acts as an early indicator and tells how the Nifty 50 is likely to open.
- Note whether the Nifty is opening with a gap up or gap down. A large gap-up often sees early selling pressure as traders book overnight positions. A gap-down can trigger stop-loss cascades followed by sharp recoveries.
- Look at the options data for the day. The Put-Call Ratio (PCR) and the levels with the highest open interest concentration are often called max pain or OI walls. It gives you a rough sense of where options are positioned and where the market may face resistance or find support.
- Mark the previous day’s highs, lows, and the closing price on your chart.
Types of Technical Analysis Used in Nifty Intraday Trading
Intraday traders on the Nifty 50 generally work with three main approaches.
Each one reads the market from a different angle, and many experienced traders use some combination of all three.
1. Price Action Analysis in Nifty Intraday Trading
Price action analysis means making trade decisions from the price chart alone. No indicators, no overlays, just how the price is moving and where it reacts.
Many experienced traders consider it the foundation of everything else because price is the most current, unfiltered data available.
An indicator is always derived from price; it will always lag slightly behind what the candle is already showing you.
In Nifty intraday trading, price action mostly comes down to watching how the price behaves around key support and resistance levels, does it hold, does it break, does it bounce?
That reaction tells you far more than any formula applied to it.
How to Trade Nifty Using Price Action Analysis?
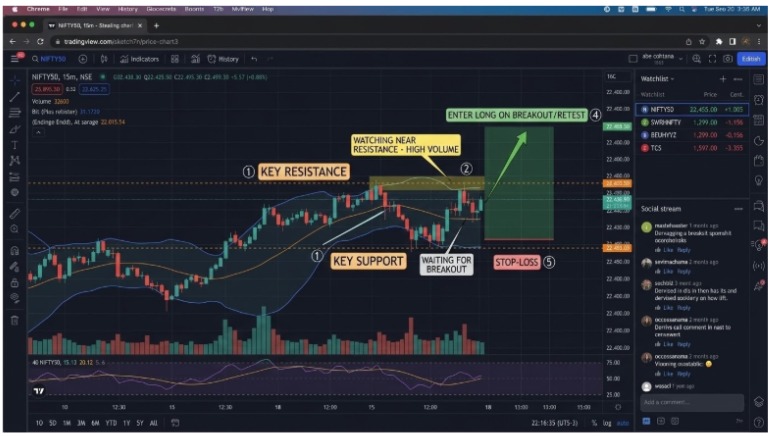
- Mark key support and resistance levels before the session. At the start of each day, identify the price zones where Nifty has previously reversed or consolidated, yesterday’s high and low, obvious consolidation zones, and levels the market has tested more than once.
These are areas where traders tend to place orders, making reactions around them more predictable.
- Watch how the price behaves as it approaches those levels. Is it coming in with momentum or running out of steam?
Candles that shrink in size near resistance are telling you that buyers are losing conviction; that’s meaningful context before you commit to a trade.
- Wait for confirmation before entering. A level by itself is not a trade signal. You need to see how the price reacts: a strong rejection candle, a decisive break with follow-through, or a clear hold.
Acting before that confirmation is one of the most common and costly mistakes in intraday trading.
- Enter in line with the broader intraday trend. If Nifty breaks above resistance with conviction, that’s a potential long entry. If it falls through support, that’s a potential short.
Always make sure the trade direction aligns with the trend visible on your chart.
- Define your stop-loss before you enter. Place it just below the support level for long trades and just above resistance for short trades.
Without a predefined stop, you’re not managing risk; a stop-loss is what separates a trade from a gamble.
2. Trend Analysis in Nifty Intraday Trading
Markets don’t move in straight lines. They move in waves, pushing in one direction, pulling back, then resuming.
Trend analysis is the discipline of identifying which direction those waves are heading and positioning yourself on the right side of that move.
In an uptrend, each rally goes higher than the last, and each pullback holds above the previous low, a sequence of higher highs and higher lows.
In a downtrend, the reverse applies: lower highs and lower lows. When neither pattern is clear, the market is ranging, and that’s usually the wrong time to be looking for trend-following setups.
How to Trade Nifty Using Trend Analysis?
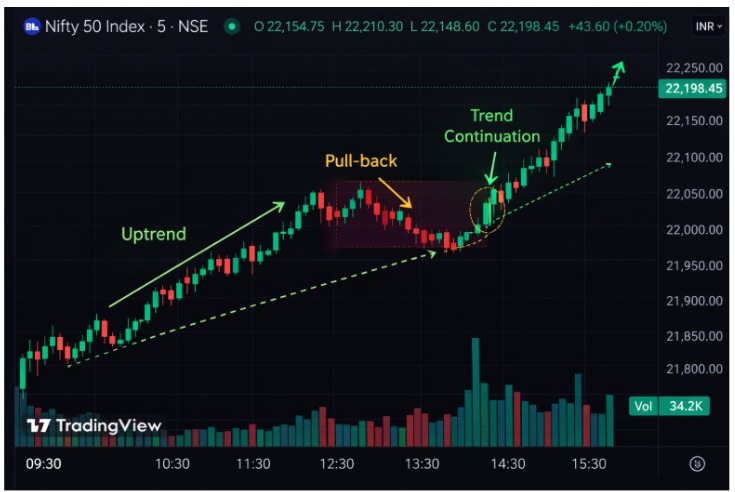
- Identify the trend using a 5 or 15-minute chart. Look for a clear sequence of higher highs and higher lows to confirm an uptrend, or lower highs and lower lows for a downtrend. If the structure is unclear, it’s often better to wait for a cleaner setup than to force a trade.
- Wait for a pullback. Don’t chase the price after it’s already moved. A healthy trend will retrace to some degree, giving you a better entry with a more favourable risk-to-reward ratio. In an uptrend, wait for a dip; in a downtrend, wait for a brief rise.
- Watch for trend continuation. Look for signs that the pullback is ending, a strong candle in the trend direction, or price holding above a key level during the retracement. That’s the signal to prepare for entry.
- Take the trade at the point of resumption. Buy when the pullback appears to be ending in an uptrend, and short when the brief recovery stalls in a downtrend. Trading with the trend puts the market’s momentum behind your position.
- Manage risk with a stop-loss near the last swing point. In an uptrend, that’s the low of the most recent pullback. If the market breaks below that level, the higher-low sequence has failed, and so has the trade premise.
3. Indicator-Based Analysis in Nifty Intraday Trading
Indicators are derived from price and volume data, which means they confirm what’s already visible on the chart, just in a more structured, visual format.
Their real value is as confirmation tools rather than standalone signals. When an indicator aligns with what you’re already reading in the price structure and trend, it adds conviction to the decision.
The most commonly used indicators among Nifty intraday traders are Moving Averages (particularly the 20 and 50 EMA), RSI (Relative Strength Index), MACD, and Bollinger Bands.
How to Trade Nifty Using Indicators?
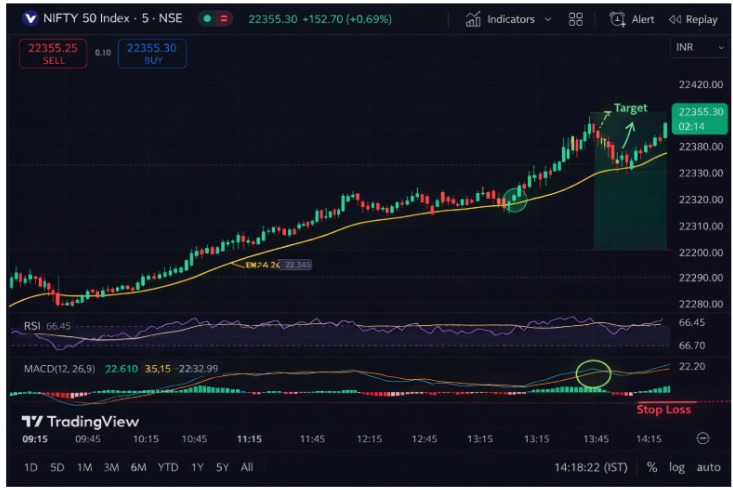
- Use a moving average to establish the trend direction. The 20 EMA or 50 EMA works well on 5 and 15-minute Nifty charts. When the price stays consistently above the EMA, the bias is bullish.
Below it, the bias is bearish. This single filter removes a lot of low-quality setups before you even look for an entry.
- Assess momentum using RSI and MACD. A rising RSI above 50 suggests buyers are maintaining pressure. Watch for divergence, if RSI starts declining while price continues making new highs, the move may be losing strength before the chart confirms it.
MACD crossovers in the direction of the existing trend add further weight to a potential entry.
- Wait for a clear signal. This could be a moving average crossover, RSI crossing above or below a key level like 50, or a MACD line crossover in the direction of the trend.
These signals confirm that conditions have shifted enough to act.
- Enter only when indicators and price structure agree. If the EMA is pointing up, RSI is above 50 and rising, and price has just bounced off a support level, that confluence is a setup.
Any two conflicting signals are a reason to wait, not proceed.
- Always use a stop-loss, regardless of how strong the setup looks. Indicators are built on historical data and will always lag behind the price to some degree.
Markets move unpredictably, and no combination of indicators eliminates risk. Protecting your capital comes first.
Risk Management and Risk Reward Ratio
Stop-loss acts as a major risk management tool. But, there is another thing that you need to follow: the risk-to-reward ratio.
Most intraday traders aim for a minimum ratio of 1:2. It means for every 100 rupees you risk on a trade, you are targeting at least 200 rupees in potential profit.
Before entering any trade, ask yourself: where is my stop, where is my target, and does the distance between them make sense?
If the nearest resistance level is only slightly above your entry but your stop is far below it, the ratio doesn’t work in your favour. Either adjust the trade or skip it.
Technical Analysis Tools for Nifty Intraday Trading
Beyond the three methods above, there are a few practical habits that consistently disciplined traders rely on.
The method is only one part of the equation; how you apply it under live market conditions is what determines your actual results.
1. Use Multiple Timeframes
Different timeframes reveal different layers of information. A 1-minute chart helps you fine-tune entry and exit timing.
A 5-minute chart is where most trade planning happens.
A 15-minute chart gives you the day’s broader structure and shows where the major levels are.
Using all three together, rather than relying on a single view, helps you avoid taking trades that look clean on a lower timeframe but are working against the structure on a higher one.
2. Watch Volume on Every Setup
Volume tells you how much conviction is behind a price move. When Nifty breaks through a key level on rising volume, that’s meaningful; it shows genuine participation.
The same breakout on thin volume deserves scepticism.
Low-volume moves often stall or reverse quickly, and you can end up in a trade that looked like a breakout but was really just a drift.
Before acting on any breakout or trend trade, always check whether the volume supports it.
3. Avoid Overtrading
There’s a tendency among new traders to equate screen time with opportunity. It isn’t. On most trading days, there is only one or two setups that genuinely meet all your criteria. The rest are marginal.
Taking marginal trades is how accounts get slowly ground down, not through one big loss, but through a steady accumulation of small ones driven by impatience.
Waiting for the right setup is a skill, and it takes longer to develop than most traders expect.
4. Be Aware of High-Impact News Events
High-impact events, RBI policy announcements, inflation data, budget sessions, and major global triggers can cause sharp, sudden moves in the Nifty that don’t follow any technical pattern.
A perfectly structured setup can be erased in seconds when a surprise announcement hits.
Many experienced intraday traders mark these dates on their calendar in advance and avoid holding positions around them. Missing the initial move is frustrating.
Being caught on the wrong side of a news shock is far worse.
Conclusion
Nifty intraday trading rewards structure and consistency over tips and guesswork.
Price action, trend analysis, and indicator-based methods each give you a different way to read the market, and when used together, they create a layered, well-rounded view of what the Nifty is doing and where genuine opportunities might exist.
Start with one method. Spend time studying how it behaves on the chart before risking real capital. Learn to recognise setups before they fully develop.
Pair that with clear risk management on every trade, and you’ll be building habits that compound over time, which is what consistent intraday trading actually looks like in practice.
If you are interested in learning the concepts of Nifty intraday trading with technical analysis, you can join our stock market classes.
Frequently Asked Questions
Q1: Which candlestick patterns work best for Nifty intraday?
Ans: The three most reliable ones are:
- The hammer (signals reversal at support).
- The bullish/bearish engulfing (confirms momentum shift).
- The doji (warns of indecision before a reversal).
Always wait for the candle to fully close before acting on any pattern.
Combining them with a key support or resistance level makes the signal significantly stronger.
Q2: Which timeframe is best for Nifty intraday technical analysis?
Ans: The 5-minute chart is the most widely used timeframe for Nifty intraday trading as it balances detail and clarity without the noise of shorter intervals.
Use the 15-minute chart to identify the broader trend and key support and resistance levels before planning your trade.
Once you have your setup ready, drop to the 1-minute chart only to fine-tune your entry and exit timing.
Q3: Is technical analysis enough for profitable Nifty intraday trading?
Ans: Technical analysis provides a strong foundation for reading price movement and timing entries, but it must be paired with strict risk management to produce consistent results.
No chart pattern or indicator eliminates market risk, making discipline and stop-losses equally important as the analysis itself.
Before investing capital, invest your time in learning Stock Market.
Fill in the basic details below and a callback will be arranged for more information: