Most traders blame their strategy when a trade goes wrong. But the real culprit is usually sitting right at the top of their chart: the timeframe they chose.
A perfectly read setup on the wrong timeframe will bleed your premium before the move even begins. Every minute you spend waiting for a signal on the wrong chart, theta is quietly eating into your premium.
Before you even realize the trade was good, the opportunity has already passed you by.
This is exactly why understanding which time frame is best for option trading can completely transform how you trade.
In this blog, let’s break down which timeframe combination is trusted by the most traders.
Why Time Frame Matters In Option Trading?
Before we actually dive into choosing the best time frame for option trading, let us understand its importance.
Options are sensitive instruments. Price, time decay, and volatility all play a role.
A small delay in entry can reduce profit significantly.
If you use the correct timeframe, you can control the following:
- Entry timing
- Noise vs clarity
- Trade duration
- Risk exposure
Note: Options lose value every passing minute due to theta decay, even if the price doesn’t move.
This is why an option buyer using a slow 30-min or 1-hour chart is taking on unnecessary theta risk; by the time a signal forms, a significant premium may already be lost
For buyers: faster timeframe = faster decisions = less theta erosion.
To avoid losses from time decay, option buyers generally prefer 5-min or 15-min timeframes and trade intraday, and some opt for far expiry options like monthly expiry rather than weekly expiry, as it carries comparatively less theta value
Best Candlestick Time Frame For Option Trading
While there isn’t a single ideal solution, certain times are more effective in actual marketplaces.
Selecting a timeline that strikes a balance between timeliness and clarity without overpowering you with noise is crucial.
Some commonly used time frames are:
|
Timeframe |
Use Case |
| 1-minute |
Scalping, high risk |
|
5-minute |
Intraday entries |
| 15-minute |
Trend confirmation |
|
30-minute |
Strong trend direction |
Your trading strategy and risk tolerance will determine the appropriate timeframe.
The optimal balance between quick submissions and trustworthy trends is frequently achieved by combining shorter and longer durations.
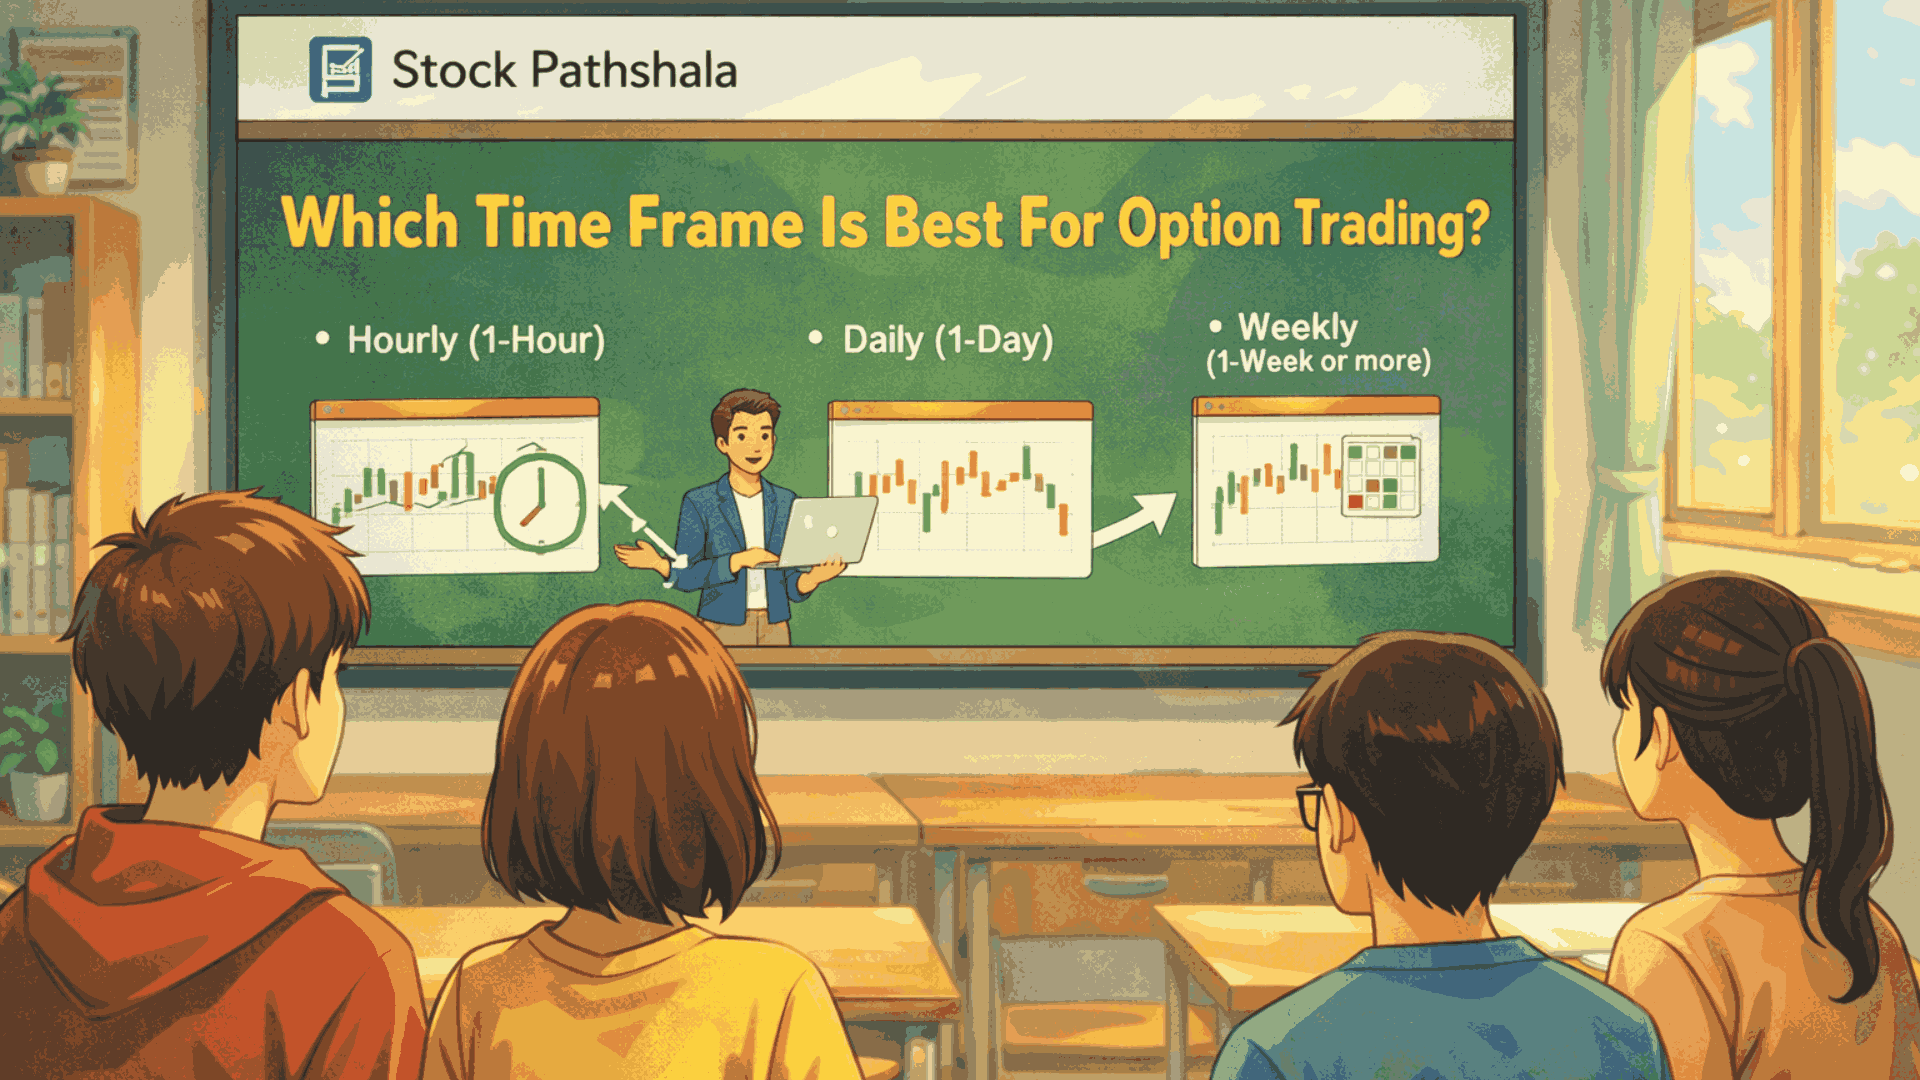
Now that you know various time frames used in option trading, let’s come to the main question asked by multiple traders: which time frame is best for option trading?
The best time frame in option trading is:
- 5-minute for entries
- 15-minute for confirmation
This combination is widely used by experienced traders. It filters noise while keeping entries precise.
So, when asking which time frame candle is best for option trading, the answer is often a mix, not a single chart.
Best Timeframe for Option Buyers vs Option Sellers
Buyers and sellers have quite different trading tactics, particularly when it comes to selecting the appropriate term.
Gaining an understanding of this differential may increase profitability, lower risk, and improve timeliness.
- Option Buyers:
- For accurate entry and exits, use 5-minute charts.
- To verify the direction of the short-term trend, use 15-minute charts.
- In flat markets, time decay works against holding periods, so keep them brief.
- Option Sellers:
- Prefer 30-minute, 1-hour, or daily charts for strategy planning.
- Use 15-minute charts to monitor positions and track trend levels.
- Can afford slower reactions as time decay benefits them over time.
Because sellers must manage a significant option trading margin, they often stick to higher timeframes to avoid being shaken out by small, intraday price “noise” that doesn’t affect the larger trend.
Understanding these variations enables traders to match their tactics with the appropriate period, improving decision-making and reducing needless losses.
Best Time Frame For Intraday Option Trading
Intraday option trading needs speed with control. That’s where timeframe selection becomes critical.
Choosing the right timeframe can be the difference between catching a strong move and getting stopped out too early.
The ideal setup is often:
- Trend: 15-minute chart
- Entry: 5-minute chart
- Fine-tuning: 1-minute (optional)
Many traders also pair this timeframe logic with the best indicators for options trading, such as VWAP or RSI, to ensure the price momentum matches the chart signal.
Now, you might be wondering why this setup works. It works in the following ways:
- You avoid trading against the trend
- You enter with better timing
- You reduce unnecessary trades
Example:
Let us understand it through a chart example to better understand:
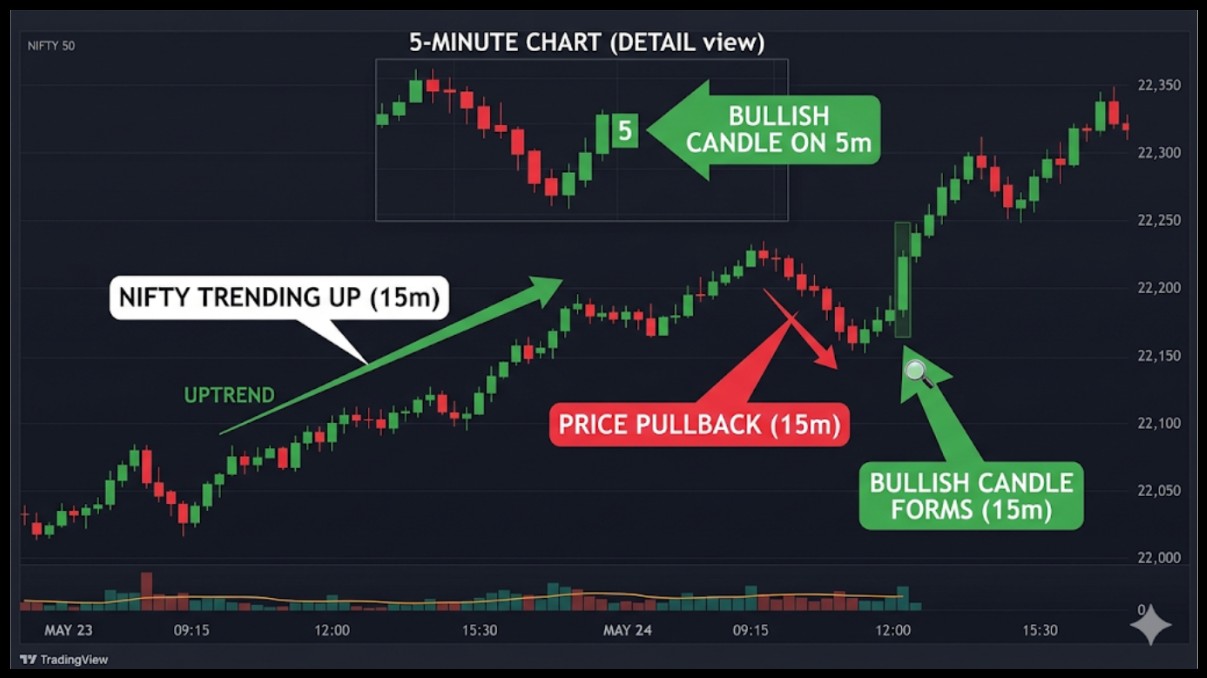
- Nifty is trending up on the 15-minute chart
- Price pulls back
- On the 5-minute chart, a bullish candle forms
That’s your entry signal. Not before, not after.
This approach answers the question: the best time frame for intraday option trading is not a single one; it’s layered.
Does Expiry Day Affect Which Timeframe You Use?
Expiry selection in options isn’t just a detail; it changes how you trade. Your chart timeline should show how weekly and monthly expenses behave.
- Weekly Expiration (Thursday for Nifty & Bank Nifty): Even 5-minute charts appear sluggish due to the quick premium decay. To catch quick changes, traders frequently switch to 1-minute or 3-minute charts.
- Monthly Expiry: 15-minute or 30-minute charts are useful for seeing patterns without being whipsawed because the premium decays more slowly.
- Reasoning: Due to rapid time decay, waiting on a 15-minute chart during a weeklong expiration might cause you to miss important changes.
You may keep ahead of the market and prevent missed opportunities by being aware of expiration-specific timings.
How Many Minute Candles Are Best for Options Trading?
Your trading personality will determine this. Candles with shorter timeframes, such as one or three minutes, are ideal for scalpers who are quick to enter and quit.
Intraday traders can identify clearer trends and steer clear of superfluous noise by using candles with longer timeframes, such as 15 or 30 minutes.
Now, if you are a scalper, you can use the following:
- Use 1-minute or 3-minute
- Expect quick profits and quick losses
But, if you are an intraday trader:
- Use 5 minutes for entries
- Use 15 minutes for direction
If your main preference is stability, then:
- Use 15-minute or 30-minute
- Fewer trades, better accuracy
Key Insight:
- Lower timeframe = more trades, more stress
- Higher timeframe = fewer trades, better clarity
Selecting the ideal candle is more about you than it is about the market. Your trading style, risk tolerance, and daily chart attention level all play a role.
Multi-Timeframe Strategy: The Real Edge
Single-timeframe trading works, but multi-timeframe trading works better. It lets you align your entry with the bigger trend while timing your moves more precisely.
Simple Structure:
- Higher timeframe → trend
- Lower timeframe → entry
Example Setup:
Have a look at the setup given below in the chart. What do you observe?
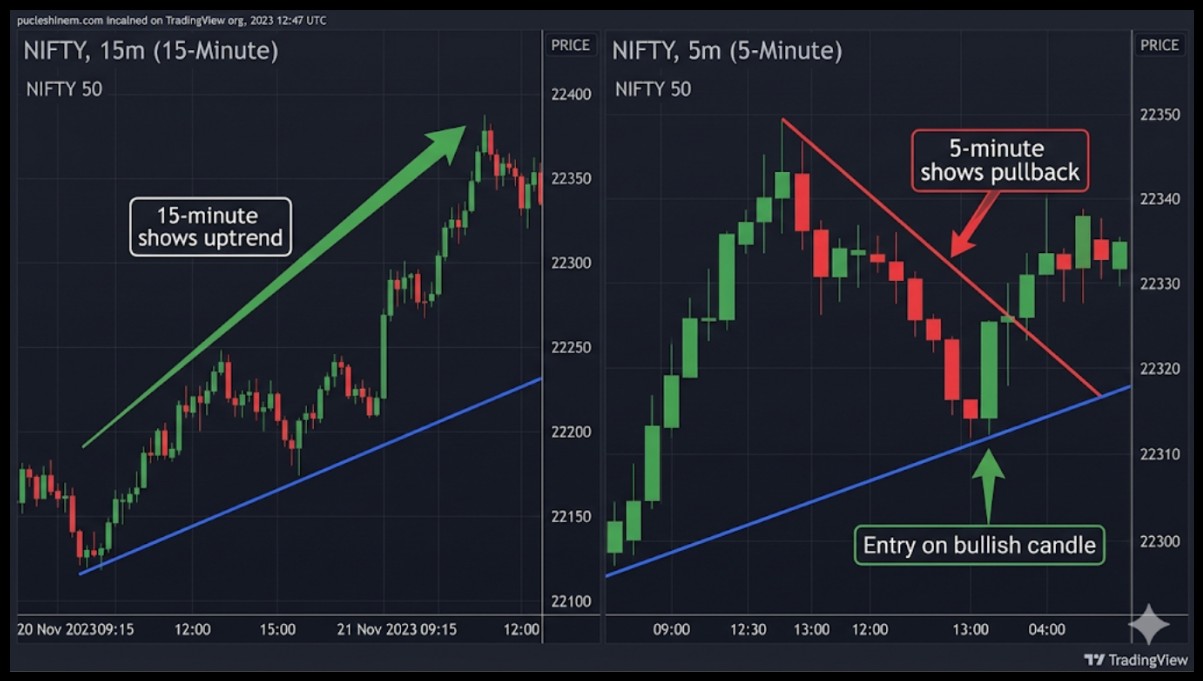
- 15-minute shows uptrend
- 5-minute shows pullback
- Entry on bullish candle
Now, why does it work?
- It aligns direction with timing
- It reduces false signals
- It improves consistency
This is how experienced traders approach markets. Not by guessing, but by stacking probabilities. They focus on aligning trend, momentum, and entry timing to tip the odds consistently in their favour.
How to Actually Switch Between Timeframes?
For novices, switching between times might seem difficult, but if you understand the procedures, it’s actually rather simple.
You may identify trends and time entry without making your chart setup too complicated by combining higher and lower periods.
Practical Steps:
- TradingView: For the same instrument (such as the Nifty spot or Bank Nifty spot), open two chart windows side by side, one on a 15-minute timeframe and one on a 5-minute timeframe.
- Zerodha Kite: Use the chart tab and the top toolbar to choose between 15 and 5 minutes.
- Rule of Thumb: Decide trend direction on 15-min first. Once in a trade, manage entry, stop, and exit only on 5-min.
- Avoid: Never switch back to 15-min mid-trade to “check” the trend, as this causes emotional exits.
By following this approach, beginners can confidently use multi-timeframe setups without confusion or impulsive decisions.
Real Trading Example
Let’s make it real with numbers. This helps you see exactly how timeframe choices affect entries, stops, and potential profits in actual market conditions.
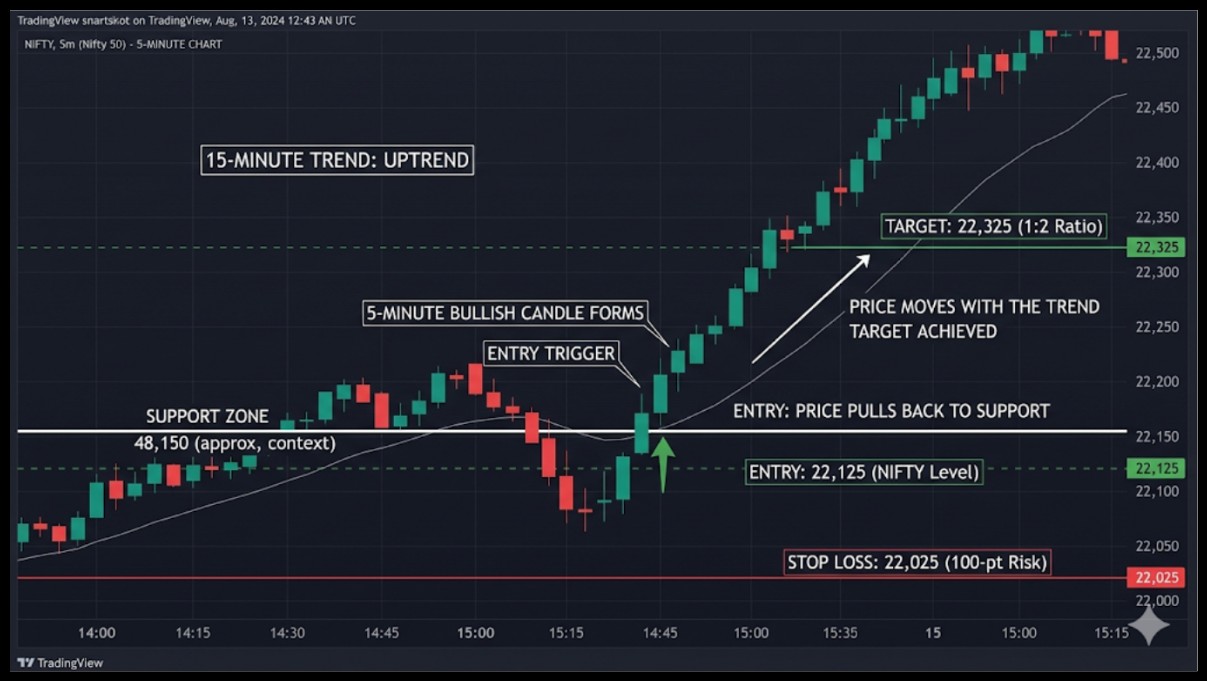
The setup of the above given chart shows:
- Instrument: Bank Nifty
- 15-minute trend: Uptrend
- Price: 48,200
Entry Conditions:
- Price pulls back to support
- 5-minute bullish candle forms
- Entry at: 48,250
Risk And Target:
- Stop loss: 48,150
- Risk: 100 points
- Target: 48,450 (1:2 ratio)
Outcome:
- Price moves with the trend
- Target achieved
Now imagine taking the same trade on a 1-minute chart. You might exit early or enter late due to noise.
That’s the difference the timeframe makes.
Best Time of Day for Option Trading
Timing matters as much as the chart you use. Even the best setups can fail if trades are placed at the wrong time.
Understanding the option trading time and the daily rhythm of the market helps traders capture profits while minimising risk.
- 9:15 AM – 9:30 AM: Avoid. High volatility, false signals, and irrational premiums during gap opens.
- 9:30 AM – 11:30 AM: Best window for buyers. Strong volatility reflects overnight news and sentiment; quick profit opportunities arise.
- 11:30 AM – 2:00 PM: Midday lull. Premiums flatten, theta decay accelerates. Buyers should be cautious; sellers can benefit.
- 2:00 PM – 3:30 PM: Volatility picks up again. Another chance to purchase, but to lower late-day risk, square off deals before 3:15 PM.
By concentrating on these time periods, traders may better match their approach with market behaviour, increasing consistency and overall performance.
Mistakes While Choosing the Best Time Frame for Options
Timeframe mistakes are subtle but costly. Even a small mismatch between your chart and strategy can turn a winning setup into a losing trade.
So, you need to be aware of some common mistakes to avoid. These are:
- Trading only on 1-minute charts
- Ignoring the higher timeframe trend
- Switching timeframes randomly
- Overtrading due to too many signals
- Holding option positions too long on expiry day
- Using the option chart instead of the underlying chart
This is a straightforward fact. Seldom is the strategy the issue. Usually, it’s the choice of timeframe.
Selecting the appropriate time range might be the difference between steady profits and ongoing annoyance.
Conclusion
So if you still ask: Which period of time is ideal for trading options? There isn’t just one number that answers the question. It’s a mix.
For guidance, use the 15-minute chart. For submissions, use a 5-minute chart. If you can tolerate the loudness, add one minute.
Keep things simple. Continue to be consistent. Above all, align your trading style with your period.
The actual progress starts there.
Still unsure which timeframe suits your option trades best? Join our option trading classes and learn how to use the right timeframe with clarity and confidence.
FAQs
Q1: How Many Minutes Candle Is Best For Option Trading?
Ans: 5-minute candles are widely used for entries, while 15-minute candles provide better trend clarity.
Q2: Which Candlestick Time Frame Is Ideal for Trading Options?
Ans: While the 15-minute chart aids in trend confirmation, the 5-minute chart is ideal for entry. Accuracy and timeliness are enhanced when both are used together.
Q3: Can Beginners Use One-Minute Timeframes for Trading Options?
Ans: One-minute charts should be avoided by beginners since they produce excessive noise and misleading signals. It is more solid and manageable to start with 5-minute and 15-minute charts.
Q4: Is the 15-minute chart better than the 5-minute chart for option trading?
Ans: Neither is better alone. The 15-minute chart shows trend direction while the 5-minute chart fine-tunes your entry. Using both together gives more accurate and confident trades than relying on either one in isolation.
Q5: Should I use the option chain chart or the underlying index chart for timeframe analysis?
Ans: Always use the underlying index chart, like Nifty spot or Bank Nifty spot, for your timeframe analysis. Option charts are driven by premium fluctuations and can be misleading.
Before investing capital, invest your time in learning Stock Market.
Fill in the basic details below and a callback will be arranged for more information: