
Most traders study the right strategy but still end up losing money consistently. The real problem is not their strategy. They are simply reading the wrong timeframe.
A perfect setup on a 5-minute chart can look like complete noise on a daily chart. This is exactly why knowing which time frame is best for trend analysis changes everything for a trader.
The timeframe you choose decides whether you see a clean trend or confusing price chaos. It shapes your entries, your exits, and your overall confidence in every single trade.
In this blog, you will learn how to match the right timeframe with your trading style and start reading the market with clarity.
What Is Time Trend Analysis?
A period in trading is the duration represented by each bar or candle on a chart. Five minutes of price movement are represented by each candle on a five-minute chart.
On a daily chart, each candle denotes a full trading day.
Before picking a timeframe, it helps to understand what time trend analysis actually means and why it matters for your trades.
Simply put, it means studying how prices move over a set period of time to figure out which direction the market is heading.
Trends can be long-term marches, medium-term waves, or short-term swings.
Every time period has a unique viewpoint:
- Although they are sometimes noisy, short-term trends capture rapid price fluctuations.
- Clarity and adaptability are balanced in medium-term trends.
- Long-term trends give you the clearest picture of overall market direction, though they reflect slower price movements and react less quickly to sudden changes.
For instance, a daily chart is preferable for identifying significant uptrends in Bank Nifty, while a 5-minute chart would be ideal for day trading Nifty futures.
Understanding this difference helps you stay focused on real market moves and avoid getting misled by short-lived price fluctuations.
Which Time Frame Is Best To Identify Trends?
Finding the ideal time frame often depends on your trading style. Which time frame is best to identify trends? There’s no single answer, but some practical rules apply.
|
Trading Style |
Best Timeframe | Purpose |
| Scalper | 1M – 5M |
Micro-trend entries |
|
Day Trader |
15M – 1H | Intraday trend direction |
| Swing Trader | 4H – Daily |
Medium-term swings |
|
Position Trader |
Weekly – Monthly |
Major trend capture |
To put it simply, longer charts depict the river’s flow, whereas shorter charts illustrate every ripple.
For instance, the Nifty may briefly decline on a 15-minute chart, but the daily chart may continue to indicate an increasing trend.
Traders may use multiple periods to align entry with the overall trend.
Which Timeframe Should Beginners Start With?
Getting started can feel overwhelming, especially when every chart seems to be telling a different story. In this case, simplicity is crucial.
As a beginner, your only goal should be understanding how price moves, not catching every single opportunity.
If you’re just getting started, start with the daily chart. It reduces market noise, shows more distinct patterns, and gives you enough time to think things through before passing judgment.
Traders often overtrade and react emotionally when periods are shorter. Once you are comfortable reading daily patterns, you may go to a 4-hour chart to modify your entries and exits.
This method gradually increases confidence. What really increases trading consistency is learning to understand the market with patience and clarity rather than responding to every price move.
Which Is The Best Chart To Use For Trend Analysis?
Once you have picked your timeframe, the next step is choosing the right chart type to read that trend clearly.
Because they offer a clear visual depiction of open, close, high, and low values, candlestick charts are frequently employed.
While line charts are simpler and useful for lowering noise, bar charts provide greater detail for precise levels.
Specifically, identifying intraday support and resistance becomes much easier on these detailed charts, as they highlight the exact price zones where the market has historically paused or reversed during a single session.
For trend analysis, consider these examples:
- A daily candlestick chart for spotting the overall market direction.
- A 4-hour chart to fine-tune entries on a trending stock.
- A 15-minute chart for short-term scalping opportunities.
The decision is based on your intraday trading strategy and time horizon. Confirmation may be obtained by combining charts; a trade that is consistent across daily, one-hour, and fifteen-minute charts is frequently more dependable.
Note: Heikin-Ashi charts are helpful for novices trying to discern trend direction since they smooth out price activity and make trends simpler to see.
What Is The Best Time Frame For Trendline?
Trendlines are essential for spotting support and resistance. Knowing the best time frame for drawing trendlines helps you avoid false breakouts and act on more reliable signals.
- Short-term trendlines: 15- or 30-minute charts show little adjustments.
- Medium-term trendlines: Intraday fluctuations are tracked using 1-hour or 4-hour charts.
- Long-term trendlines: Weekly or daily charts show significant changes in the market.
At least two price contact points are necessary for a trendline to be considered genuine; the more touches without a break, the stronger the trendline.
For example:
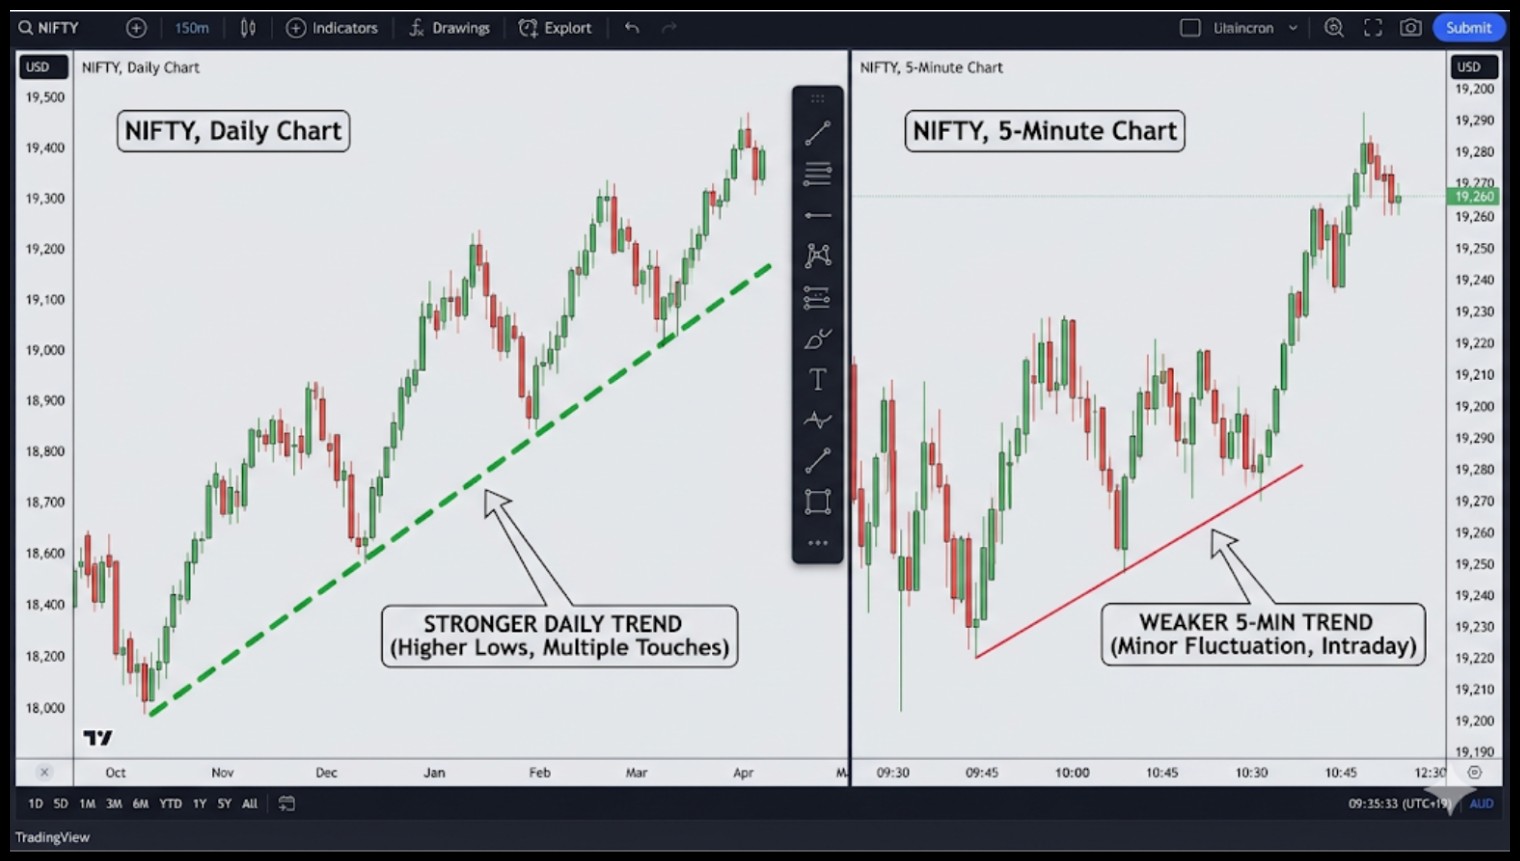
A trendline formed on the daily chart is stronger than one made on the 5-minute chart if Bank Nifty has higher lows. This prevents minor intraday fluctuations from overwhelming you.
Multi-Timeframe Approach: Seeing The Bigger Picture
Relying on just one timeframe can seriously mislead your market reading and lead to poor trade decisions. Refining entry and exits is made easier by combining many periods.
Here is a useful configuration:
- Daily chart: Identify the dominant trend.
- 4-hour chart: Spot medium-term swings for entry points.
- 15-minute chart: Fine-tune timing for execution.
It’s critical to comprehend why traders choose a top-down strategy before implementing the multi-timeframe method.
To determine the general trend and important levels of support or resistance, always begin with the longer timeframe.
This avoids misunderstanding and provides you with context.
Because little changes can skew the larger market picture, starting with a shorter timeframe, such as a 5-minute chart, frequently results in noise and biased conclusions.
Trend Confirmation vs Trend Entry
One thing most traders completely overlook is the difference between using a timeframe for confirmation versus using it for entry.
While the lower timeframe is utilised for trend entry, the upper timeframe is employed for trend confirmation.
To put it simply, the 15-minute chart indicates when to enter, while the daily chart indicates the direction.
A 5-minute chart should never be used to determine the direction of the market since it may result in transactions that defy the larger trend.
For instance:
The 4-hour chart indicates a brief decline, even if Nifty may be on a daily rise. It is possible to reduce risk and boost the likelihood of success by entering on a 15-minute chart following a little rebound.
This alignment boosts your trade’s conviction and decreases false signals.
Recommended Timeframe Combinations
Understanding multi-timeframe analysis is important, but having ready-to-use combinations makes the whole execution process much simpler.
Because they are unsure of which charts to really utilize together, beginners frequently struggle.
Think of these combinations as a roadmap, as they help you align your entry point, market structure, and trend direction without second-guessing yourself.
Ready-To-Use Timeframe Setups:
|
Trading Style |
Entry Timeframe | Structure | Trend Direction |
| Scalper | 5M | 15M |
15M |
|
Day Trader |
15M | 1H | 4H |
| Swing Trader | 1H | 4H |
Daily |
|
Position Trader |
Daily | Weekly |
Weekly |
How These Combinations Are Used:
- To determine the general trend, use a longer timeframe.
- Mark the levels of support and resistance using the mid-timeframe.
- For precise trade entries, switch to a shorter timeframe.
For example, a day trader may see resistance on the 4-hour chart, refine it on the 1-hour screen, and then join the market at that level on the 15-minute chart.
This multi-layered approach improves timeliness and reduces bogus signals.
These pairings provide your analysis coherence and facilitate decision-making. Instead of assuming which chart to use, you follow a logical process that suits your trading style.
Practical Tips For Time Frame Selection
Your trading selections can be made or broken by the time frame you choose.
These simple tips will help you match the right chart with your strategy and avoid the most common timeframe mistakes.
- Align the time frame with your trading style: day traders don’t need weekly charts.
- Use longer timeframes for trend confirmation.
- Shorter charts are for precise entries, not overall trend direction.
- Avoid using extremely short charts alone; they’re noisy and lead to overtrading.
A swing trader may, for example, use a daily chart to verify an uptrend, but they wouldn’t enter until they saw a distinct retreat on a 4-hour chart.
This strategy combines opportunity and clarity.
Common Timeframe Mistakes To Avoid
Selecting the appropriate time range is crucial, but avoiding typical errors is even more crucial.
Many traders lose because they approach periods inconsistently rather than because their levels are incorrect.
Your entire trading setup can be subtly distorted by a tiny analytical error.
What To Watch Out For:
- Using only one timeframe leads to false signals and poor context
- Starting analysis from the lowest timeframe creates a biased market view
- Switching timeframes too often mid-trade causes confusion and emotional decisions
- Using too many timeframes at once results in analysis paralysis
These mistakes may seem small individually, but they quietly damage your trading results over time.
When you follow a consistent and structured approach to timeframes, your analysis stays clear, and your trade decisions become far more confident.
Real Trading Scenario
In real markets, theory meets reality, and trends can behave unpredictably.
Let’s look at a concrete example to see how different timeframes guide practical trading decisions.
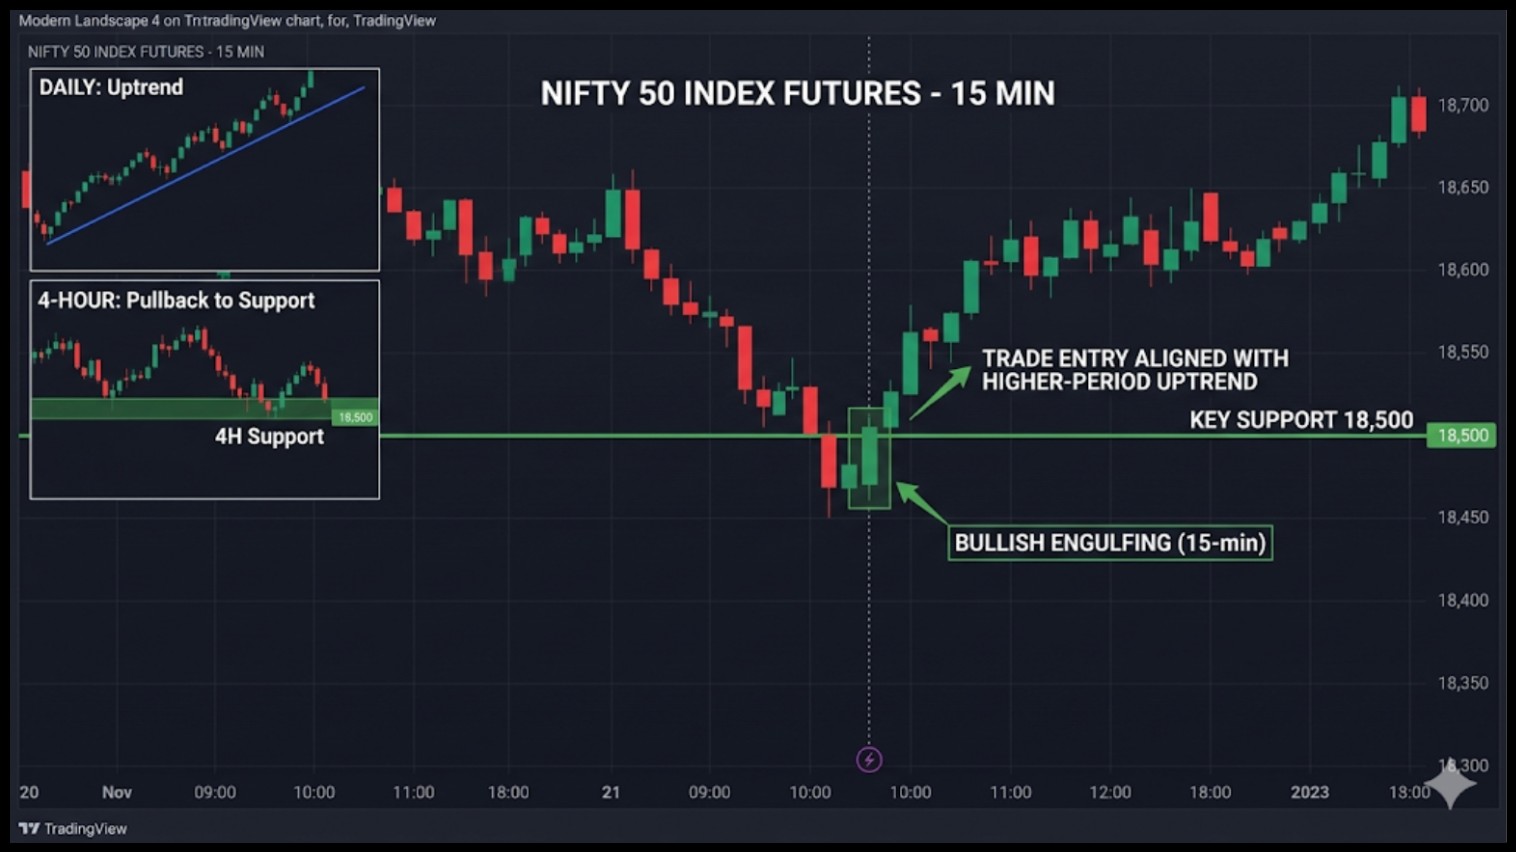
- Stock: Nifty 50
- Daily trend: Uptrend confirmed via higher highs and higher lows.
- 4-hour pullback: Price dips to a key support level at 18,500.
- 15-minute entry: A bullish engulfing candlestick confirms momentum.
By aligning all three timeframes, the trader enters with the major trend instead of fighting against a short-term intraday dip.
Conclusion
Choosing which time frame is best for trend analysis is not a one-size-fits-all answer. It fully depends on your trading style, your patience level, and the asset you are trading.
Shorter timeframes show you speed but come with a lot of unnecessary noise. Longer timeframes give you clarity, but they move slowly and require more patience.
The smartest approach is always to combine multiple timeframes, so you confirm the trend first and then enter with precision.
Stop jumping between random charts and build a consistent timeframe routine that matches your strategy.
Start with one combination, practice it consistently, and let your results speak for themselves.
Take the next step in your learning with our stock market classes, where we simplify multi-timeframe analysis using real charts and practical guidance.
FAQs
Q1: Can I rely on a single time frame for trend analysis?
Ans: While possible, using one timeframe often leads to false signals. Multi-timeframe confirmation improves reliability.
Q2: Should scalpers use daily charts?
Ans: Scalpers focus on short-term charts for entries; daily charts can provide overall trend context, but are less practical for execution.
Q3: How often should I change my timeframe?
Ans: Change it only if your trading style changes. Short-term traders rarely switch to daily charts, and long-term traders rarely use 5-minute charts.
Q4: Which timeframe do professional traders mostly use?
Ans: Most professional traders rely on the daily and 4-hour charts for trend direction and drop to the 15-minute or 1-hour chart only for precise entries. They rarely make decisions based on charts below 15 minutes.
Before investing capital, invest your time in learning Stock Market.
Fill in the basic details below and a callback will be arranged for more information: