


Many beginners ask, “Can I use Fibonacci retracement for intraday trading?”
The short answer is yes, but only with the right swing, the right levels and proper confirmation.
Used with discipline, it helps you plan where a pullback may end and where your stop loss should sit.
Does Fibonacci Retracement Work for Intraday Trading?
If you trade intraday, you may often struggle to identify where a price pullback could stop and the original trend could continue.
Fibonacci retracement can help you identify potential pullback zones and plan your trades more systematically.
It works on charts where price moves in clear swings. Intraday charts have those swings every day, so the tool fits well.
However, it does not predict anything. It only marks zones where many traders are watching.
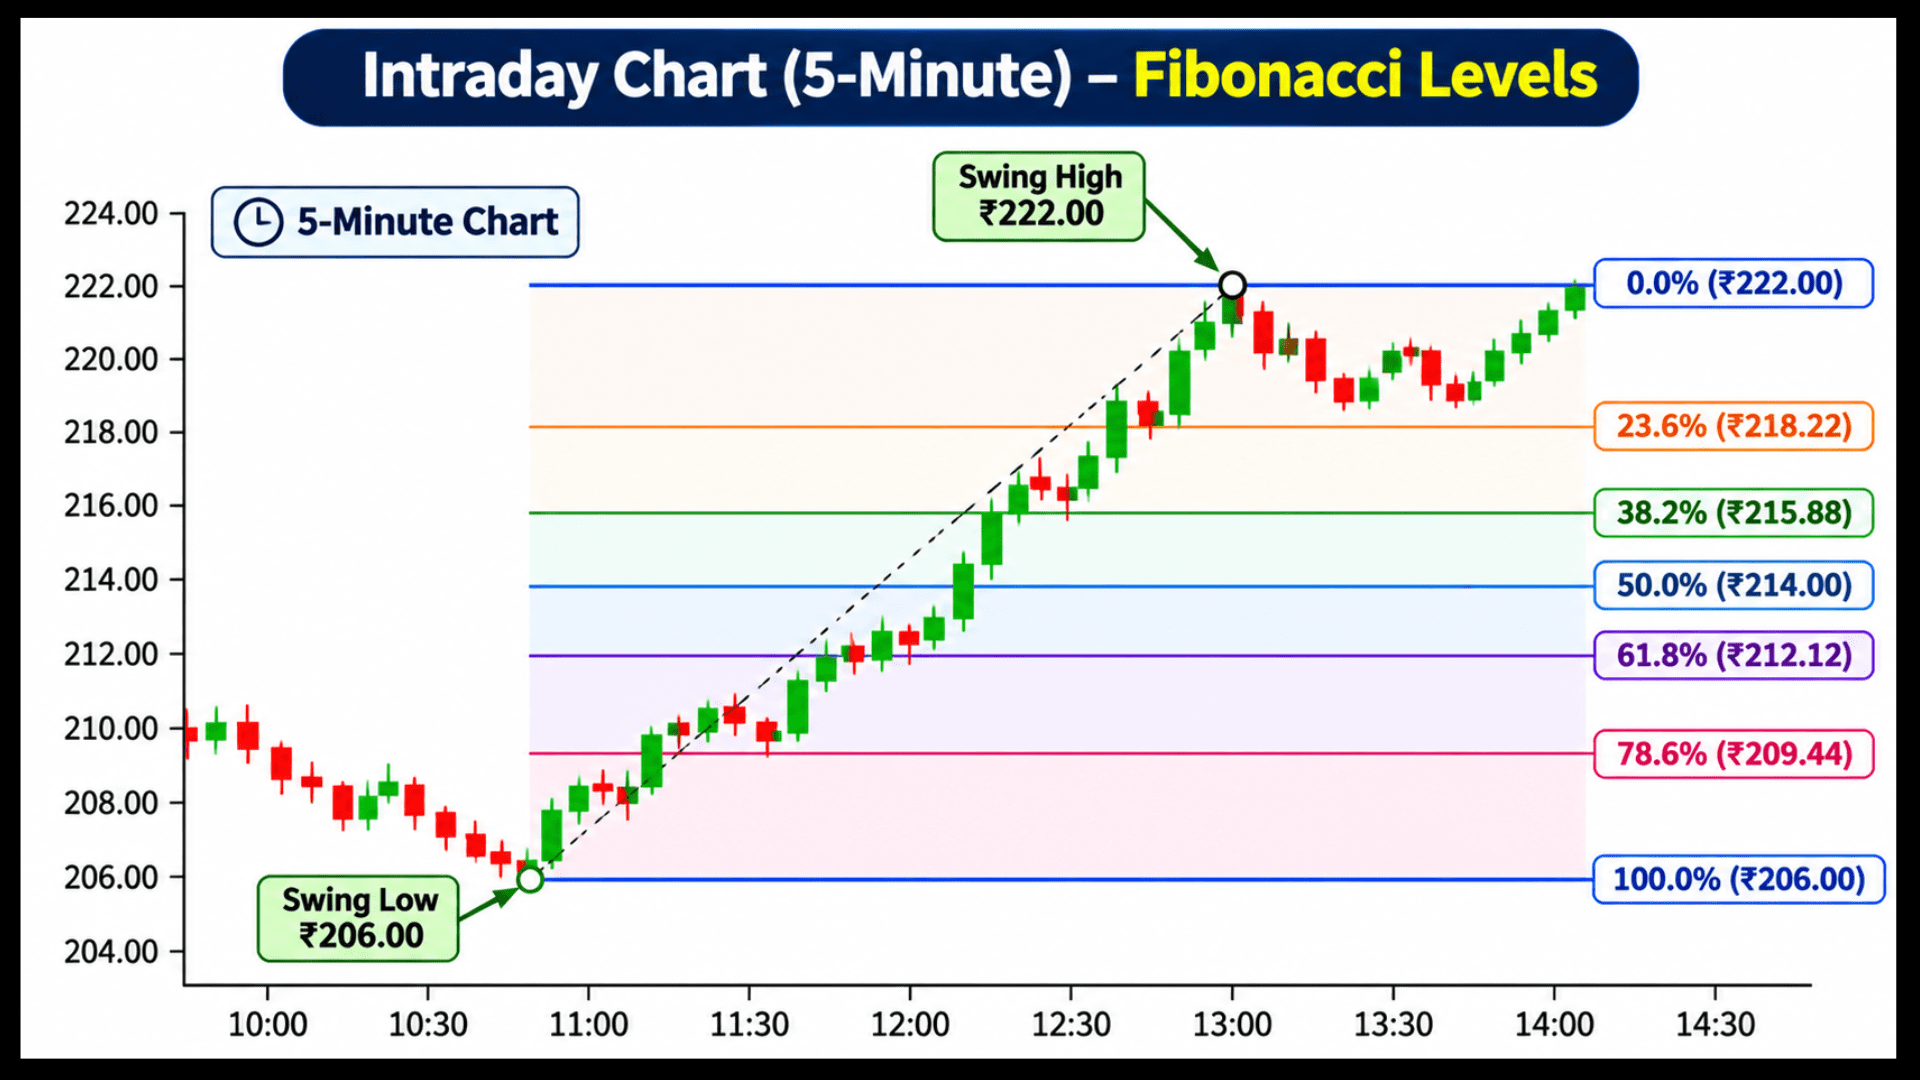
Think of it as a map of pullback zones, not a buy signal. If you enjoy the wave side of Fibonacci, you can read how traders mix wave counts with ratios in Elliott wave with Fibonacci, but that is a separate topic from today.
How to Draw Fibonacci Retracement on an Intraday Chart?
Drawing Fibonacci retracement correctly is half the work. A wrong swing gives wrong levels, however good your entry looks.
Before drawing the tool, you need to identify the correct swing points on your chart.
Which Swing to Pick: Today’s Chart vs. Previous Session
For a clean trend day, draw from today’s lowest point to today’s highest point after the first strong move.
For a gap day or a sideways morning, many traders also mark the previous session’s high and low, because those prices still matter to the market.
Use the swing that is most recent and most obvious. If you have to squint to find it, skip the trade.
Step-by-Step: How to Draw Fibonacci Retracement
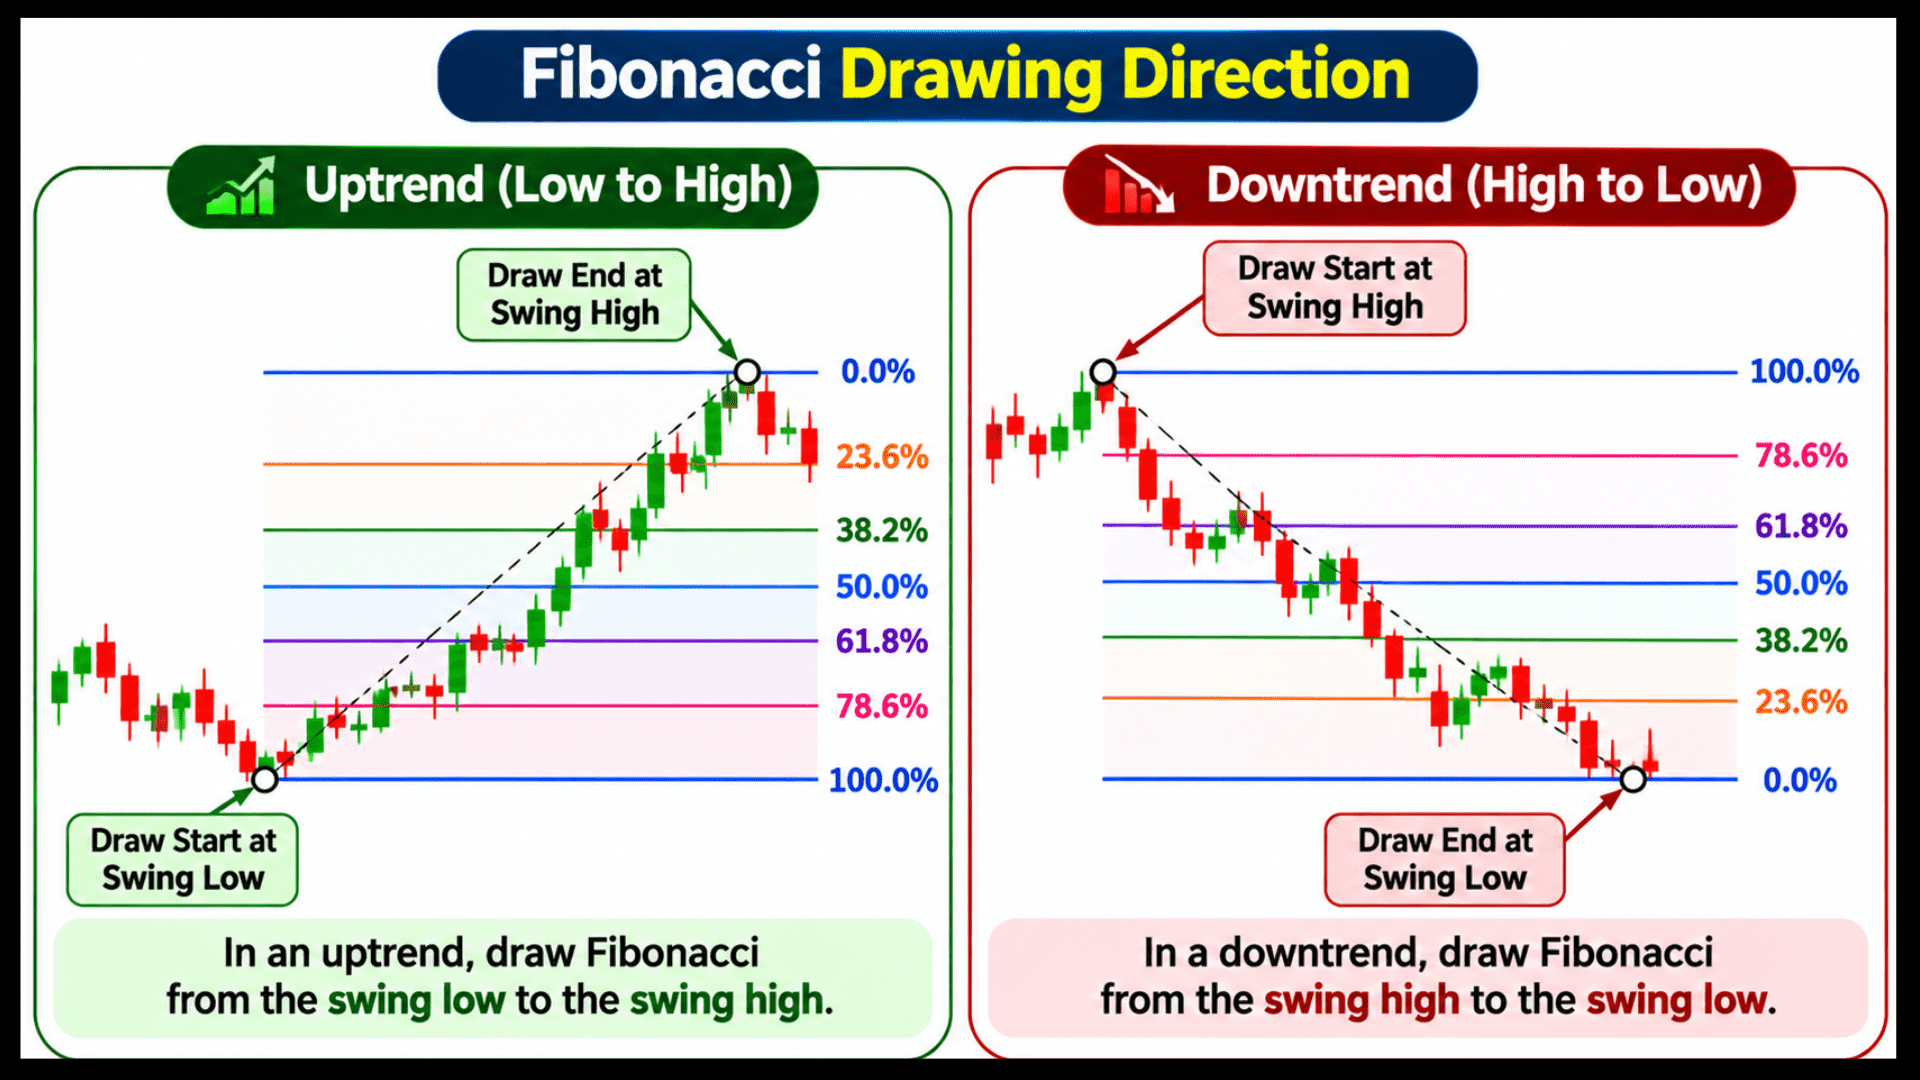
- In an uptrend: Click on the swing low first and drag to the swing high.
- In a downtrend: Click on the swing high first and drag to the swing low.
- Wait for confirmation: Use candle wicks so your swing points match what most people see. Then wait for price to pull back instead of chasing.
Which Time Frame Is Best for Fibonacci Retracement in Intraday Trading?
Choosing the right time frame helps you identify clearer swings and avoid unnecessary market noise.
Most intraday traders use the 5-minute and 15-minute charts. A 5-minute chart gives quicker signals, while a 15-minute chart gives cleaner swings with fewer fake moves.
So yes, a Fibonacci retracement 5 minute chart setup works, but it also gives more noise.
Many beginners find it easier to pick the swing on the 15-minute chart and time the entry on the 5-minute chart.
The same logic applies to support and resistance levels. If you want to understand why higher time frames give stronger zones, read which time frame is best for support and resistance.
Avoid the 1-minute chart while learning. The swings are tiny, so every candle seems to touch a level.
Fibonacci Levels for Intraday: What Do 38.2%, 50% and 61.8% Mean?
Three levels do most of the work on intraday charts. Each one tells you something different about how strong the pullback is.
Here is a quick view of what each level means before we go deeper.
| Level | What It Means | How Traders Read It |
|---|---|---|
| 38.2% | Shallow pullback | Strong trend, buyers or sellers are in a hurry |
| 50% | Middle of the move | Common reaction zone, watched by many traders |
| 61.8% | Deep pullback | Last common zone before the trend may fail |
Notice that 50% is not a true Fibonacci ratio. It comes from the older idea that markets often retrace about half of a move, and it is so widely used that it is on almost every platform.
The 61.8% level is called the golden ratio because it comes from dividing a number in the Fibonacci sequence by the next one.
If price closes clearly beyond 61.8%, treat the original swing as weak and step aside.
What Is the Best Fibonacci Retracement Intraday Strategy?
One Fibonacci level alone is a weak reason to enter a trade. A good Fibonacci retracement intraday strategy waits until two or three things agree at the same price.
This is called confluence, where multiple technical indicators or price levels support the same trading decision.
1. Combine Fibonacci With Support and Resistance
If the 50% level sits near an earlier intraday high or low, that zone becomes much stronger.
You can learn how to mark such zones using support and resistance, and then check whether a Fibonacci level lands on one of them.
2. Add VWAP and EMA Confirmation
When a pullback into 50% or 61.8% also touches VWAP or a moving average like the 20 EMA, the zone gets more weight.
It shows that the average buyer for the day is also defending that price.
If you are new to these two indicators, VWAP and EMA strategy explains how they work together on a live chart.
3. Wait for Volume and Candlestick Confirmation
Price touching a level is not an entry. Wait for a candle that shows the pullback is ending, such as a bullish engulfing candle or a long lower wick near the level.
Volume should rise on the bounce candle and stay lower during the pullback.
Without that, the move may just be a pause before the next drop.
How to Set Entry, Stop Loss and Target Using Fibonacci?
Let’s put numbers on it. The prices below are made up for learning, and this is for illustration only, not a trade suggestion.
Say a share rises from ₹1,000 to ₹1,040 in the morning, then pulls back.
The table shows the levels and a sample plan for a long trade.
| Item | Price (₹) | Note |
|---|---|---|
| Swing low | 1,000.00 | Start of the move |
| Swing high | 1,040.00 | End of the move |
| 38.2% level | 1,024.72 | Price slices through it |
| 50% level | 1,020.00 | Price pauses, bullish candle forms |
| 61.8% level | 1,015.28 | Stop loss placed just below this |
| Entry | 1,021.00 | After the confirmation candle closes |
| Stop loss | 1,013.50 | Below the 61.8% level |
| Target | 1,040.00 | Retest of the swing high |
The risk is ₹7.50 per share, and the reward is ₹19 per share.
For 100 shares, that is a possible loss of ₹750 against a possible gain of ₹1,900, which gives a reward to risk of about 2.5 to 1.
Always set the stop loss at a spot where your trade idea is proven wrong, not at a number that feels comfortable.
To understand why a ratio like this matters, read risk reward ratio in intraday trading.
Your quantity should come from the amount you can afford to lose, not from the capital you have.
If you want to place the stop with more care, what should be the stop loss for intraday trading covers different ways to set it.
When Does Fibonacci Retracement Fail in Intraday Trading?
Fibonacci retracement fails when there is no clear swing to measure. It also struggles when something bigger than the chart is moving price.
Use the table below as a quick filter before you draw anything.
| Condition | Fibonacci Works Better | Fibonacci Works Worse |
|---|---|---|
| Market type | Trending day with clear swings | Choppy, range-bound day |
| News | No major event | Results, policy or global shocks |
| Candles | Orderly pullbacks | Long wicks both ways, no structure |
| Volume | Rises on the bounce | Thin and uneven |
On a choppy day, price crosses every level without respect, so you get stopped out again and again.
On a news day, price can jump through all three levels in one candle.
The best skill here is knowing when not to trade. No clean swing means sit out.
What Are the Common Fibonacci Trading Mistakes to Avoid?
Most losses with this tool come from habits, not from the tool. Here are the usual mistakes:
- Drawing from random points instead of clear swing highs and lows.
- Entering as soon as price touches a level, without a confirming candle.
- Using every level at once until the chart looks like a fence.
- Moving the stop loss further away when price goes against the trade.
- Trading on a sideways day when there is no trend to retrace.
Many of these are the same errors that push people into losses in general. Read why people lose money in intraday trading to understand the bigger picture.
Keep your chart clean, your swing obvious and your risk small.
Do you want to learn how to draw Fibonacci retracement correctly and use it with confirmation on real intraday charts?
Join our live technical analysis classes. Each session runs 1 to 1.5 hours, you learn on real charts, ask your doubts live and get personalised mentorship, with no fixed batch to wait for. We never promise profits, we teach you how to think and plan trades.
Conclusion
Yes, you can use Fibonacci retracement for intraday trading if you pick a clear swing, focus on 38.2%, 50% and 61.8%, and wait for confluence and confirmation.
Plan the entry, stop loss and target before you click buy, and skip days with no structure.
Practise on a simulated account first, and treat every example here as learning material, not a tip.
Disclaimer: This blog is for educational purposes only and is not investment advice. Please verify applicable rules on official exchange and SEBI websites.
Frequently Asked Questions
Before investing capital, invest your time in learning Stock Market.
Fill in the basic details below and a callback will be arranged for more information: