

Ever watched a chart and felt like it was breathing? Up, down, pause, surge. Markets move in patterns. Not random chaos. Not perfect order either. Somewhere in between.
And that is where Elliott Wave analysis plays a vital role, but again, just relying on this analysis can also put you in trouble.
To make your predictions more accurate, you can combine Elliott wave with Fibonacci.
This combination blends crowd psychology with math. One reads the rhythm. The other measures it.
Let us explain.
Elliott Wave Principle & Fibonacci Retracement
At its core, Elliott wave theory with Fibonacci combines two ideas:
- Elliott Wave Theory was created by Ralph Nelson Elliott in the 1930s.
- Fibonacci ratios, which are based on the famous Fibonacci sequence.
Elliott observed that markets move in repeating wave structures driven by collective emotion.
Elliott observed that markets move in repeating wave structures driven by collective emotion.
A complete cycle consists of an Impulse Wave pattern with 5 waves in the direction of the trend, followed by 3 corrective waves against it.
So you get an 8-wave structure. Five up. Three down. Or vice versa in a bearish trend.
Elliott Wave Theory and Fibonacci Numbers
Now here’s where Fibonacci enters the scene. Price swings often respect specific ratios.
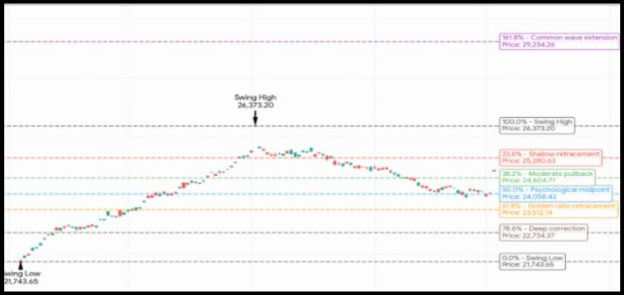
The above graph shows price swings with respect to Fibonacci ratios.
| Ratio | Common Use |
| 23.6% | Shallow retracement |
| 38.2% | Moderate pullback |
| 50% | Psychological midpoint |
| 61.8% | Golden ratio retracement |
| 78.6% | Deep correction |
| 161.8% | Common wave extension |
It’s not magic; it’s repetition. Many skeptics ask, does Elliott Wave theory work in isolation?
The truth is, it becomes much more reliable when you use Fibonacci to spot Market Correction levels.
By identifying the specific corrective pattern unfolding, whether it’s a sharp zigzag or a sideways flat, you can use these ratios to predict where the price will likely find support.
Let’s slow this down and simplify it further.
An Elliott wave with a Fibonacci retracement approach means you:
- Identify a completed impulse wave
- Apply the Fibonacci retracement tool
- Wait for price reaction at key levels
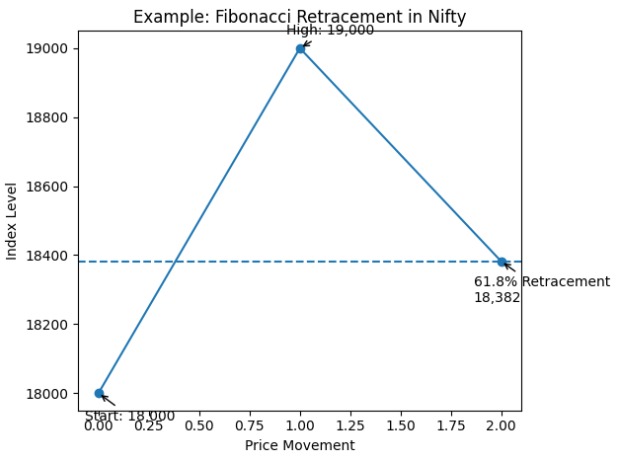
For example:
- Nifty rallies from 18,000 to 19,000
- Mark Fibonacci up to high
- Retraces at 18,382 (61.8 percent)
In case the number of waves indicates that this is Wave 2, then that level becomes critical.
You watch:
- Price action.
- Reversal patterns.
- Volume spikes.
- Maybe an RSI bounce.
Example of Elliott Wave Analysis with Fibonacci
Consider a stock that moves:
- 200 to 260 in Wave 1
- Pulls back to 225
The retracement from 260 to 225 is near 61.8 percent of the 60-point move.
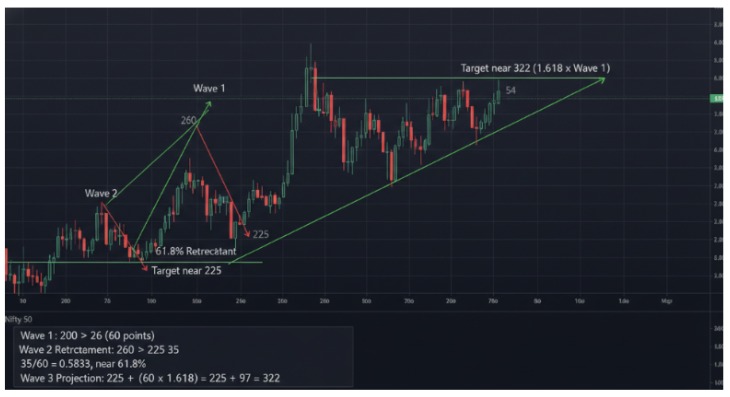
If this is Wave 2, then Wave 3 could extend:
- Wave 1 size = 60 points
- 60 × 1.618 ≈ 97 points
Projected from 225, the potential Wave 3 target becomes around 322.
Now you have structure, entry, stop, and target. That’s clarity.
Elliott Wave With Fibonacci Retracement Strategy
Honestly, the biggest mistake traders make is complexity. They see ten waves where there are three.
Here’s how to use Elliott wave with Fibonacci in a clean way:
- Focus on clear, impulsive moves
- Use Fibonacci only after the wave structure is visible
- Avoid forcing counts in choppy markets
- Combine with volume or simple moving averages
Platforms like TradingView and MetaTrader provide built-in Fibonacci tools. No fancy software needed.
And yes, sometimes your count will be wrong. That’s part of it. Markets are fluid. Elliott himself said wave interpretation requires flexibility.
So, let’s get practical. A simple Elliott wave with a Fibonacci retracement strategy works like this:
Step 1: Identify Trend: Use higher timeframe charts. Daily or 4-hour charts work well.
Step 2: Label Waves: Spot Wave 1 and Wave 2 clearly. Do not rush.
Step 3: Measure Retracement: Apply Fibonacci from Wave 1 start to end.
Step 4: Plan Entry: Look for buy setups near 50 or 61.8 percent retracement in a bullish structure.
Step 5: Target Projection: Use the Fibonacci extension tool to project Wave 3 targets at 161.8 percent.
And above all, risk management matters. Always. You place a stop below the Wave 2 low in bullish setups.
This is what traders call Elliott wave with Fibonacci high probability trading.
Not because it wins every time, but because structure and math align.
By following these steps, your Elliott Wave forecast becomes an objective roadmap rather than a guess.
Elliott Wave With Fibonacci Rules
Here’s the key thing to remember: Elliott Wave Theory follows a set of strict structural rules.
If these rules are broken, the wave count is simply invalid, no matter how well it seems to fit visually.
Some of the most important Elliott wave 4 rules and foundational laws are:
- Wave 2 cannot retrace beyond the start of Wave 1.
- Wave 3 can never be the shortest impulse wave. In most cases, it is actually the strongest and longest wave in the trend.
- Wave 4 cannot overlap with the price range of Wave 1 in a standard impulse structure.
These rules define the basic framework of the wave structure.
Now this is where Fibonacci Retracement comes in.
Fibonacci levels do not change the rules of Elliott Wave; they simply refine and support the analysis.
For example, Wave 2 may typically retrace 50%, 61.8%, or even 78.6% of Wave 1.
As long as the core rules are met, specifically that Wave 2 does not move beyond the start of Wave 1, the count remains valid.
Even a deep retracement like 78.6% is acceptable.
When this mathematical retracement aligns with a completed C-wave, it creates a high-probability Elliott Wave reversal pattern for an entry.
A common mistake traders make is forcing Fibonacci levels onto the chart first and then trying to fit the wave count around them.
This approach often leads to incorrect analysis. The correct method is simple: identify the wave structure first, then use Fibonacci levels to confirm possible retracement or extension zones.
In short, wave structure provides the roadmap, and Fibonacci helps fine-tune the potential turning points.
Conclusion
Elliott Wave gives you a narrative. Fibonacci gives you a measurement. Together, Elliott wave with Fibonacci create a framework that feels structured yet flexible. It respects psychology. It respects math.
No indicator alone works. But when wave structure and Fibonacci ratios align, something clicks. The chart feels less noisy. More intentional.
And that’s what traders seek. Not certainty. Just an edge.
FAQs
Q1: Is Elliott Wave With Fibonacci Suitable For Beginners?
Ans: Yes, but start simple. Learn wave structure first, then apply Fibonacci retracement gradually.
Q2: Does Elliott Wave With Fibonacci Work In Forex And Crypto?
Ans: Yes. It works in any liquid market because it reflects crowd psychology.
Q3: What Is The Most Reliable Fibonacci Level In Elliott Wave?
Ans: The 61.8 percent retracement and 161.8 percent extension are most commonly respected in impulse structures.
Master Elliott Wave with Fibonacci the right way, join our stock market classes, and start reading charts with real confidence.
Before investing capital, invest your time in learning Stock Market.
Fill in the basic details below and a callback will be arranged for more information:


