

Markets do not go in a straight line. Prices go up and down. On the surface level, it looks disorderly, but with practice, professional traders are able to detect the rhythm behind the fluttering.
It is that rhythm which the Elliott Wave theory seeks to explain.
Knowing how to read Elliott Wave may assist traders in reading the psychology of the market, the stage of the trend, and likely reversals. It is neither magic nor perfect.
However, when applied properly, it has the potential to show a rather organized feature within price charts.
Let us walk through the concept clearly and practically.
What Is The Elliott Wave Theory?
Elliott Wave theory was invented in the 1930s by Ralph Nelson Elliott.
He discovered that the pattern of prices is replicating, and it is brought about by the psychology of the investors after analyzing years of stock market charts.
The idea is simple.
Markets are cyclical, and the waves up and down make a cycle.
| Wave Type | Direction | Purpose |
| Impulse Waves | With the trend | Push price forward |
| Corrective Waves | Against the trend | Market pullback |
This pattern appears across timeframes. It works on a 5-minute crypto chart or a multi-year stock index chart.
In a bear market or downtrend, Elliott Wave patterns simply work in reverse.
Instead of five waves moving upward, the market forms five impulsive waves downward, followed by a three-wave upward correction before the trend continues lower.
For example, if a crypto asset drops from 100 to 70 in five waves, it may retrace to around 80 in an ABC correction before starting another five-wave decline.
Elliott Wave Rules
Before we move forward to how to read the Elliott wave, it is important to understand some crucial rules that cannot be violated.
When you sit down to draw Elliott wave patterns, these three fundamental rules serve as guardrails to ensure that traders do not count the wrong number of waves:
- A wave 2 cannot possibly retrace more than 100 percent of Wave 1.
- Wave 3 can not be the shortest among the three impulse waves (1, 3, and 5).
- Wave 4 will not overlap the price territory of Wave 1.
Every beginner asks: “How do I know if my wave count is valid?” These three rules are the answer.
How To Read Elliott Wave For Beginners?

Many new traders feel confused when they first try to learn how to read Elliott Wave for beginners. The rules sound simple, yet identifying waves on live charts takes practice.
Start with three basic steps.
Step 1: Identify The Market Trend
Ask a simple question first.
Is the market on a downward and upward trend?
When the price is experiencing higher highs and higher lows, then you are probably in an impulse phase.
You might be experiencing a corrective period if the price is either going in a straight line or correcting.
Step 2: Look for Five-Wave Movement
An impulse move contains five waves. Let us understand these waves with the help of a table:
| Wave | Description |
| Wave 1 | First move of the new trend |
| Wave 2 | Pullback as traders doubt the move |
| Wave 3 | Strongest trend wave |
| Wave 4 | Consolidation |
| Wave 5 | Final push before correction |
Wave 3 is usually the largest. That is where momentum traders enter aggressively.
Step 3: Wait For The Correction
After the five-wave move, the market forms a three-wave correction labeled A B C.
This correction often retraces 38 percent to 61 percent of the impulse move.
Fibonacci levels help confirm this area.
Master the market with confidence.
Understanding The 5 Wave Impulse Structure
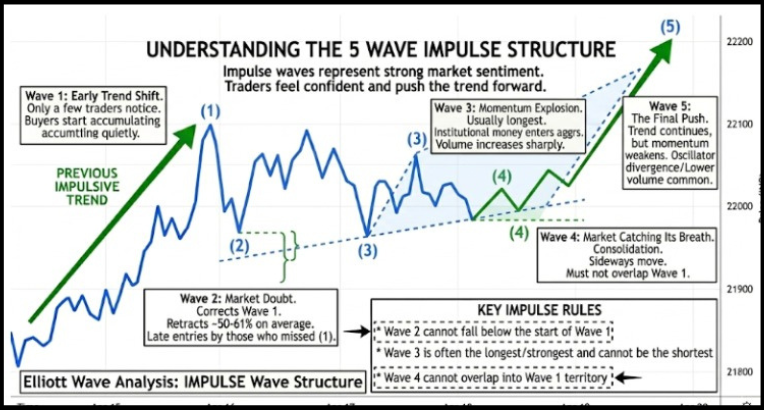
Impulse waves represent strong market sentiment. Traders feel confident and push the trend forward.
Here is how the structure behaves in practice:
Wave 1: Early Trend Shift
Only a few traders notice the change.
Example scenario:
- A stock falls for months
- Buyers begin accumulating quietly
- Price rises slightly
The majority of traders are still of the opinion that it will go down.
Wave 2: Market Doubt
Wave 2 corrects Wave 1.
Rules to remember:
- Wave 2 is not allowed to fall below the beginning of Wave 1.
- It retracts on average 50 percent or 61 percent.
Traders who missed the first move often enter here.
Wave 3: The Momentum Explosion
Wave 3 is usually the longest and strongest wave among Wave 1, 3 and 5.
Institutional money enters aggressively. News headlines often appear during this phase.
Example:
- A technology stock breaks resistance
- Volume increases sharply
- Retail traders rush in
This is where trends feel obvious.
Wave 4: Market Catching Its Breath
Wave 4 forms a consolidation.
Key rule:
- Wave 4 cannot overlap Wave 1
Price may move sideways for days or weeks.
The Principle of Alternation: According to the Principle of Alternation, wave 2 and wave 4 of the five-wave impulse tend to have different structures.
When Wave 2 creates a sharp zigzag correction, Wave 4 will normally take the shape of a sideways with either a flat or triangle shape that assists traders in determining the kind of correction to be expected.
Wave 5: The Final Push
The trend continues, but momentum weakens.
Signs of Wave 5:
- Lower trading volume
- Oscillator divergence
- Overbought signals
Experienced traders begin reducing positions here.
How To Read Elliott Wave Oscillator?
The Elliott Wave Oscillator (EWO) helps traders confirm wave strength and identify potential trend exhaustion. It measures momentum shifts that often align with different stages of an Elliott Wave cycle.
The indicator is typically calculated as the difference between a 5-period and 35-period simple moving average applied to bar midpoints, not closing prices.
This setting highlights changes in market momentum more accurately for wave analysis.
| Wave Stage | Oscillator Behavior |
| Wave 1 | Small momentum peak |
| Wave 3 | Strongest and highest peak |
| Wave 5 | Lower peak compared to Wave 3 |
Traders use this pattern to confirm wave counts. If the oscillator forms a lower high during Wave 5 compared to Wave 3, it signals weakening momentum.
This bearish divergence often indicates Wave 5 exhaustion and a possible market reversal.
The 3 Wave Correction Pattern
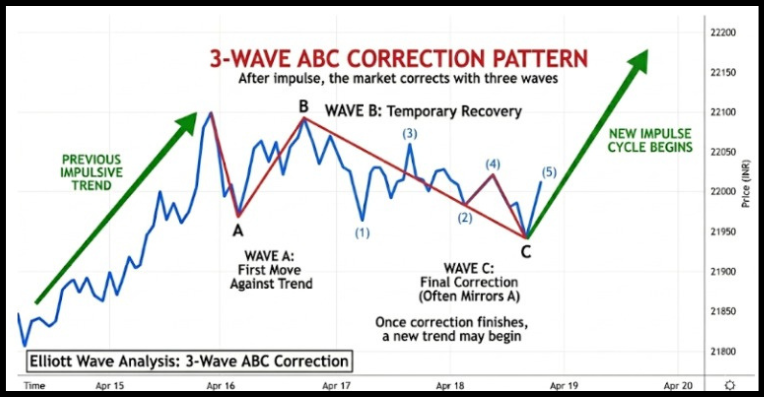
After the impulse structure, the market corrects.
The pattern forms three waves labeled A B C.
Understanding the ABC correction rules of Elliott wave helps traders identify the nature of the pullback.
| Wave | Movement |
| Wave A | First move against the trend |
| Wave B | Temporary recovery |
| Wave C | Final correction |
Wave 3 of Elliott wave cycle is usually the largest. That is where momentum traders enter aggressively.
Types Of ABC Correction Patterns
Not all ABC corrections look the same on a chart. Elliott Wave theory identifies several corrective structures, each with a different internal wave pattern and market behavior.
Understanding these variations helps traders avoid misreading sideways markets as sharp pullbacks.
Main Types Of Corrective Patterns:
- Zigzag (5-3-5) – A sharp, deep correction. Common in Wave 2 after a strong impulse.
- Flat (3-3-5) – A sideways correction where Wave B retraces deeply. Often seen in Wave 4.
- Triangle (3-3-3-3-3) – Contracting price action before the final trend move.
- Combination Corrections – Two corrective patterns linked together, creating longer consolidations.
How to Read Elliott Wave Charts in Real Trading With Example
Understanding how to read Elliott Wave charts becomes easier when looking at real trading behavior.
Professional traders often follow this workflow.
| Step | What Traders Do |
| Trend identification | Use moving averages |
| Wave labeling | Mark potential waves |
| Fibonacci analysis | Measure retracement zones |
| Confirmation | Check volume and momentum |
Example trading scenario:
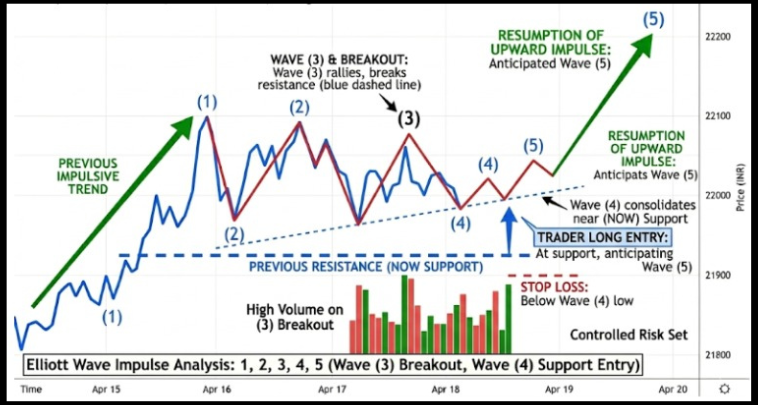
A trader analyzes Bitcoin on a 4-hour chart.
- Price rallies forming Waves 1, 2, 3.
- Wave 3 breaks resistance with high volume.
- Wave 4 consolidates near support.
- Trader enters long, expecting Wave 5.
Stop loss is placed below Wave 4.
This creates a controlled risk trade.
Practical Trading Tips When Using Elliott Wave
Elliott Wave works best when combined with other tools.
Experienced traders follow a few practical rules.
- Always confirm waves with Fibonacci retracement.
- Use support and resistance zones.
- Combine with RSI or MACD.
- Never trade without a stop loss.
A practical risk example:
| Trade Setup | Risk Control |
| Wave 3 entry | Stop below Wave 2 |
| Wave 5 entry | Stop below Wave 4 |
Even the best wave count can fail. Markets react to news, liquidity changes, and macro events.
Risk control always comes first.
Common Mistakes Traders Make In Reading Elliott Wave
Many traders struggle because they force patterns onto charts.
Common errors include:
- Labeling waves before a trend forms
- Ignoring Elliott Wave rules
- Trading every small movement
- Forgetting risk management
- Multiple Valid Wave Counts Can Exist
- Markets Sometimes Ignore Ideal Patterns
- Alternate Counts Are Necessary
The truth is slightly frustrating. Elliott Wave works better when traders stay patient and flexible.
Sometimes the correct wave count only becomes clear after the move is complete.
Conclusion
Learning to read Elliott Wave takes time, practice, and a genuine curiosity about market psychology.
In the beginning, the waves will seem chaotic and hard to pin down, but with consistent chart work, the patterns start to reveal themselves naturally.
Always come back to the fundamentals: the 5-wave impulse and the 3-wave correction are the foundation on which everything else builds.
Support your analysis with tools like Fibonacci levels and momentum indicators to add confidence to your wave counts.
Above all, never overlook risk management. Even the most clearly formed wave patterns can break down in live market conditions.
Protecting your capital is just as important as reading the chart correctly.
Master the market with confidence. Join our Elliott Wave classes today and learn how to read charts like a professional trader.
FAQs
Q1: How Is The Easiest Way To Read Elliott Wave?
Ans: Begin with daily charts to learn how to determine the 5-wave impulse and 3-wave correction.
It is possible to visualize the patterns with the help of charting software, such as TradingView.
Q2: Is Elliott Wave Beginner-Friendly?
Ans: Yes, but novice users need to use it with simple tools, such as support levels and Fibonacci retracements.
The counting of waves is enhanced by the experience of the chart.
Q3: Is The Market Predictable by Elliott Wave?
Ans: Markets cannot be accurately predicted through any method.
Trend structure and potential turning points are explained with the help of Elliott Wave; however, risk management is necessary.
Before investing capital, invest your time in learning Stock Market.
Fill in the basic details below and a callback will be arranged for more information:


