“So, Shiv, welcome to our Big Bull podcast series,” I greeted our guest, a seasoned swing trader with deep expertise in harmonic patterns.
With an impressive track record of recording around 35% profit per annum, Shiv’s success was rooted in a simple yet powerful combination of harmonic patterns and the Fibonacci series.
What followed was an insightful and engaging conversation where Shiv not only explained the “what” of trading but also delved into the “why,” offering valuable practical examples along the way.
The First Encounter: What Are Harmonic Patterns?
“Shiv, I’ve read about harmonic patterns, but I can’t quite connect the dots,” I said as I leaned in. “Can you show me how they work in real market conditions?”
Shiv smiled, ready for the challenge. “Let’s take a look at a real chart. Imagine you’re looking at a stock, say, XYZ Corp. The price shoots up from ₹100 to ₹150, then retraces back to ₹120. Now, a Fibonacci retracement tool would show you key levels, like 38.2%, 50%, and 61.8%, which are essential for spotting where the price could reverse.”
“Okay, I get that the Fibonacci levels matter, but what’s the pattern I should be looking for?” I asked.
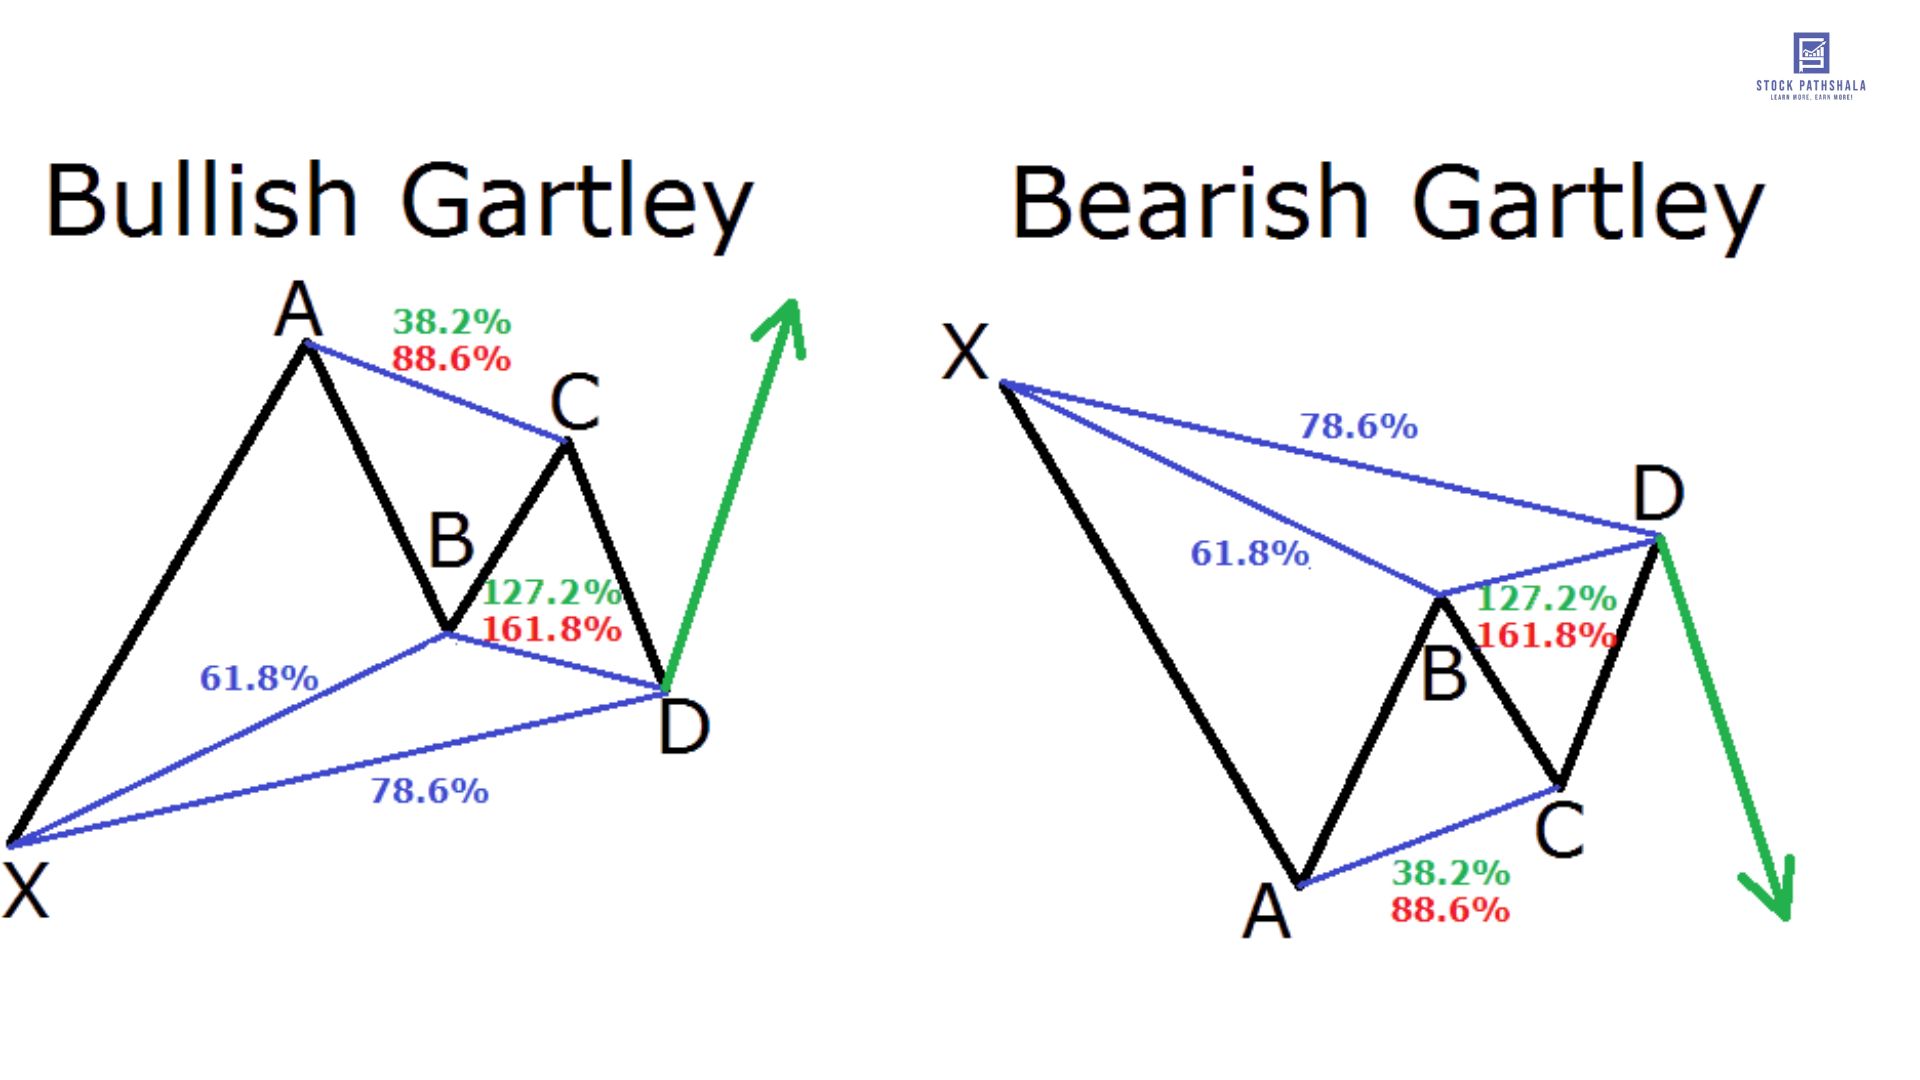
Shiv pulled up the chart on his laptop. “Look here. This price moves from ₹100 to ₹15,0 and the retracement to ₹120—this forms the basis for a Gartley pattern. If the retracement hits around the 61.8% Fibonacci level, that’s when the price is most likely to reverse and head back towards ₹150.”
Real Example: The Gartley Pattern in Action
As Shiv continued, he illustrated how the Gartley pattern works.

“In a Gartley, the price tends to retrace by 61.8% before reversing direction. Let’s look at the chart again. After the retracement to ₹120, if we see the price bounce back up towards ₹150, that’s the pattern completing. Now, what’s crucial here is timing. You need to wait for confirmation, like a candlestick reversal pattern at the 61.8% level.”
A New Pattern: The Butterfly’s Bigger Reach
“Okay, now I’m starting to see how these patterns can help,” I said, still trying to connect the dots. “But I’ve also heard about the Butterfly pattern. How is it different from the Gartley?”
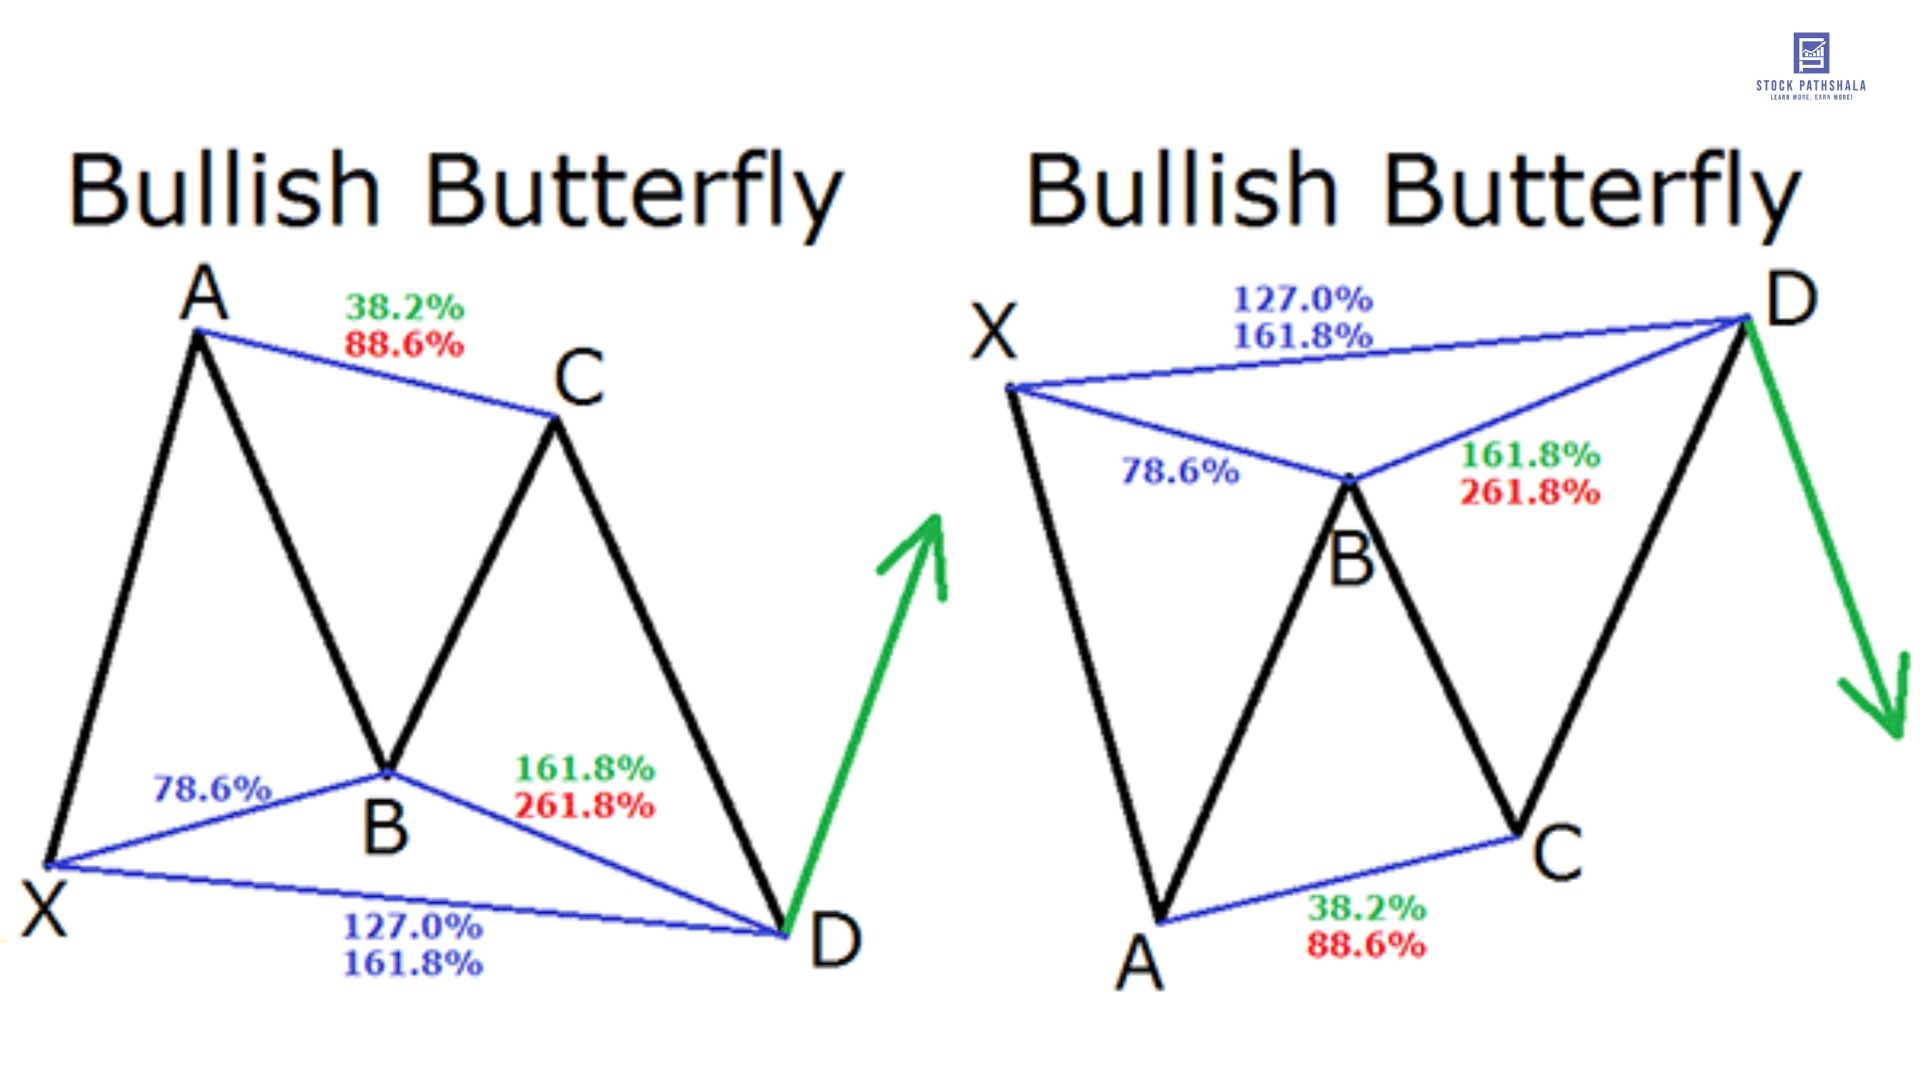
Shiv grinned. “Great question! Let’s use a practical example with the same stock, XYZ Corp. This time, the price moves from ₹100 to ₹200 and then retraces to ₹150. But instead of stopping at 61.8%, the price retraces deeper, maybe around 78.6% of the original move. This is where the Butterfly pattern comes into play.”
I raised an eyebrow, intrigued. “So, the Fibonacci ratio for the Butterfly is deeper?”
“Exactly,” Shiv confirmed. “The Butterfly pattern often stretches beyond the typical 61.8% and can hit 78.6%. After retracing deeply, the price should then extend beyond the previous high of ₹200, making this pattern ideal for longer-term trades.”
Real Example: The Butterfly Pattern’s Play
Shiv brought up a chart of XYZ Corp, showing how the price retraced to ₹150 (near 78.6% of the original move). Then, as predicted, the price surged past ₹200, confirming the Butterfly pattern’s completion.

“The key takeaway here,” Shiv emphasized, “is that the deeper retracements are usually more aggressive patterns like the Butterfly. They’re not as common as the Gartley, but when they appear, they often offer a powerful move.”
The Bat Pattern: Precision and Fibonacci’s Perfect Fit
“So, we’ve covered the Gartley and Butterfly,” I said, “but I keep hearing about the Bat pattern. What’s different about this one?”
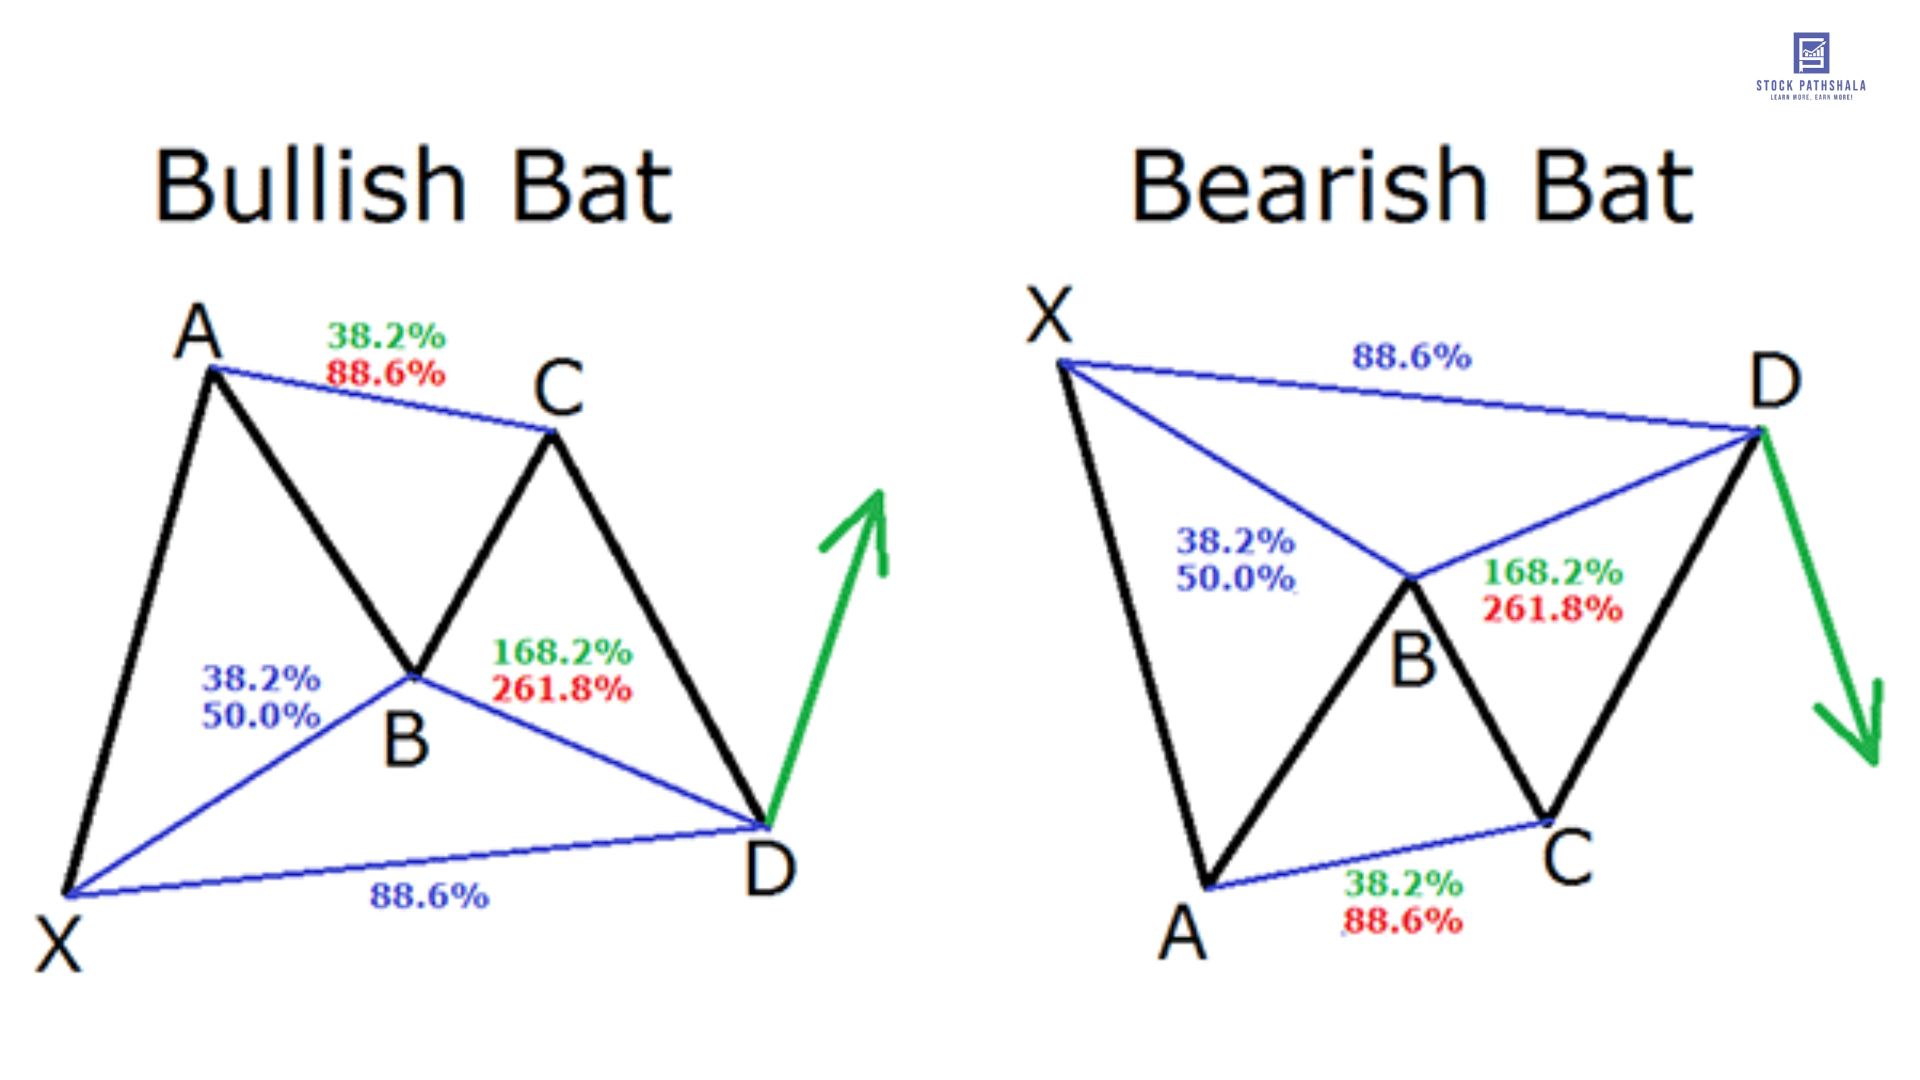
Shiv chuckled. “You’re on a roll! The Bat pattern is another pattern that uses Fibonacci ratios, but the key difference is that the retracement is usually around 50%. In simpler terms, the Bat pattern has a shallower retracement compared to the Butterfly but offers similar opportunities.”
I leaned forward. “Can you show me an example?”
Real Example: The Bat Pattern
Shiv zoomed in on another chart. “Let’s say the stock moves from ₹100 to ₹200, and the price retraces to ₹150. But here, instead of the deep retracement, the stock pulls back just 50% of the original move, settling at ₹150. This is where the Bat pattern completes. After this, the stock is likely to reverse direction, heading back towards ₹200.”
“The interesting thing,” Shiv continued, “is that the Bat pattern is considered to be a ‘high-probability’ setup. When the price reaches that 50% Fibonacci level, the odds of a successful reversal are generally very favorable.”

Timing and Entry: How Fibonacci Guides Us
I was starting to see the bigger picture. “So, once we spot these patterns and Fibonacci levels, how do we enter a trade?”
Shiv leaned in, his expression serious. “The real key is confirmation. You don’t just blindly buy when the price reaches the Fibonacci level. Look for other signals like candlestick patterns, momentum indicators, or even a slight price consolidation at the Fibonacci level. Let’s go back to XYZ Corp.”
He pulled up the chart once more. “Let’s say the price hits the 61.8% level, and you see a bullish engulfing candlestick pattern forming. This is your confirmation to enter the trade, ideally after the reversal is confirmed.”
Risk Management: Navigating the Waves of Harmonic Patterns
“But what if the pattern fails?” I asked, genuinely concerned. “How do we manage risk?”
Shiv’s face softened. “Risk management is key. Even the best harmonic patterns don’t always work, and that’s why you need a stop-loss. For example, if you enter a trade on the Gartley pattern, you might set a stop-loss just below the 78.6% Fibonacci level. If the price breaks this level, it’s a sign that the pattern is invalid, and you exit.”
Mindset and Patience: The Key to Success
Finally, I asked, “Is there a particular mindset that helps when trading these patterns?”
Shiv nodded slowly. “Patience is everything. Harmonic patterns don’t form overnight, and sometimes, you’ll have to wait weeks for the perfect setup. Trust the process and stick to your plan. It’s not about catching every move—just the high-probability ones.”
Conclusion: Fibonacci and Harmonics in Swing Trading
As the conversation ended, I had a new appreciation for the art of recognizing harmonic patterns and how Fibonacci played such a pivotal role.
By using practical examples, I could now see how these patterns were not just theoretical concepts but powerful tools for predicting market reversals and executing profitable trades.
From the Gartley to the Butterfly and Bat patterns, Fibonacci was the core, providing the roadmap for these patterns to unfold.
But, as Shiv reminded me, it wasn’t just about recognizing the patterns—it was about using them with precision, patience, and risk management.
And so, with a new strategy in hand, I was ready to take on the markets with a fresh perspective, guided by the Fibonacci rhythm and the power of harmonic patterns.
Before investing capital, invest your time in learning Stock Market.
Fill in the basic details below and a callback will be arranged for more information:


