Have you ever watched kids on a swing set? First there’s the big push forward—fast, thrilling, full of energy—then comes the gentle swing back. The stock market isn’t much different. Prices don’t just climb in a neat straight line; they push forward in bursts (impulsive waves) and then ease off for a breather (corrective waves). This “impulsive vs corrective wave” cycle is like the market’s heartbeat—one pumps energy into the trend, the other keeps things balanced.
And here’s the best part: you don’t need to be a chart-reading expert to spot them.
Understanding these patterns helps everyday investors keep calm when prices surge, dip, or stall.
Instead of panicking, you’ll start to see the rhythm for what it is—completely normal.
What is an Impulsive Wave?
Impulse waves are the market’s power plays, the big strides forward (or backward, in a downtrend).
Imagine a surfer catching a strong wave: the ride feels unstoppable.
These moves often unfold in five stages:
- Wave 1: A small nudge upward, easy to miss.
- Wave 2: A quick pullback, like pausing for breath.
- Wave 3: The strongest, most exciting run. This is where the crowd jumps in.
- Wave 4: A sideways shuffle, a mini break.
- Wave 5: The final push, often powered by peak enthusiasm.
By this point, everyone is talking about the rally: friends, colleagues, even that uncle who never invests.
What is a Corrective Wave?
If impulses are the fireworks, corrections are the cooldown afterward. They help release excess energy before the market takes its next shot.
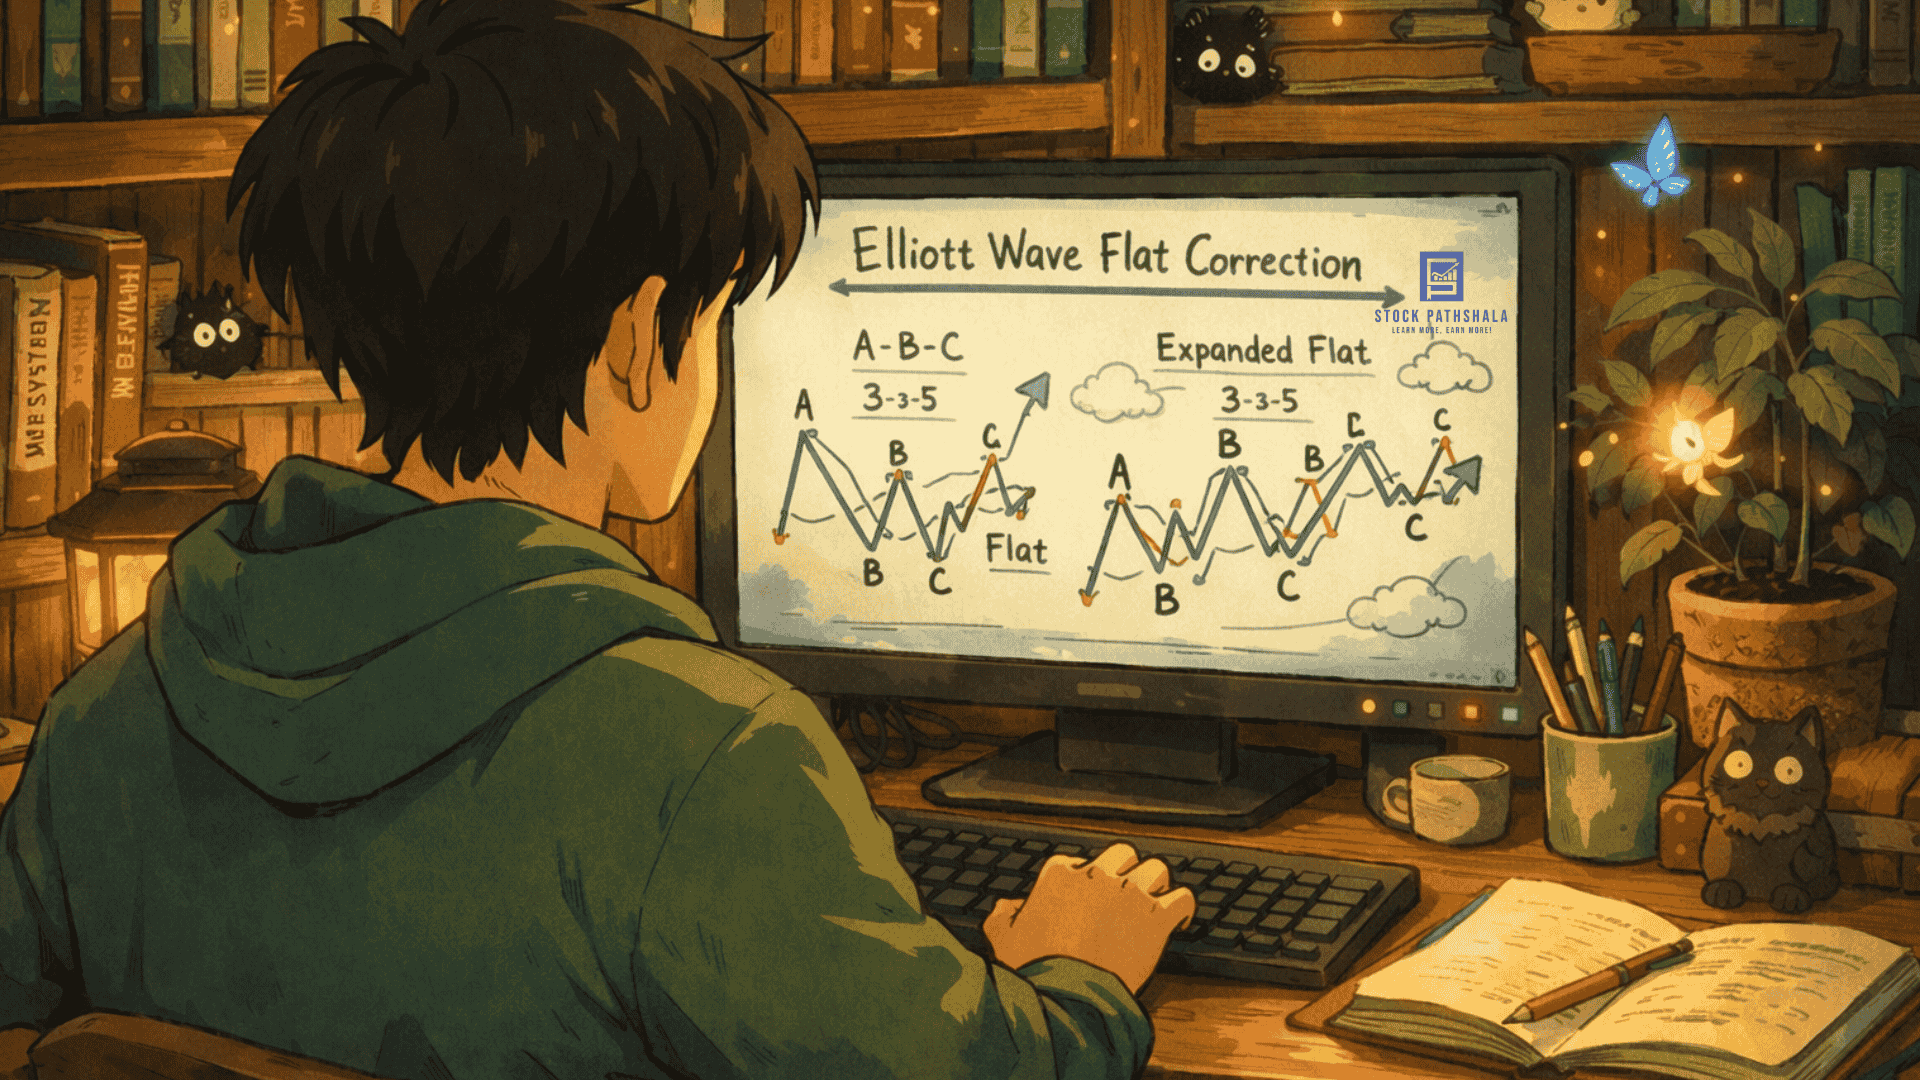
This three-step dance is known as a corrective pattern, and it usually follows a specific rhythm:
- Wave A: The first dip, where some investors get nervous.
- Wave B: A bounce that makes people think “maybe it’s fine.”
- Wave C: The deeper pullback, where weak hands usually give up.
It feels uncomfortable in the moment, but it’s healthy—it resets the stage for the next round.
A Real Example of Impulsive vs Corrective Wave
Remember the big tech surge in 2020–2021? Coming out of the pandemic crash, stocks went wild
- Wave 1: The rebound kicked off in spring 2020.
- Wave 2: A quick dip in May.
- Wave 3: The monster rally—Tesla, Zoom, Apple, you name it.
- Wave 4: A breather in early 2021.
- Wave 5: That euphoric run into late 2021, when investing was dinner-table talk.
And then came the correction in 2022:
- Wave A: Markets slipped as inflation fears spread.
- Wave B: A summer bounce sparked false hope.
- Wave C: The sharper drop as rate hikes hit hard.
So, if you want to know how to identify market correction, follow one simple rule, impulse is followed by correction.
How to Identify Wave Patterns
Spotting impulse vs corrective waves in real time isn’t always easy, but there are reliable clues. According to technical analysis basics, you can look at:
- Wave Structure: Impulse waves unfold in a 5-wave pattern, while corrective waves typically form a 3-wave sequence.
- Trend Direction: Impulses move with the main trend, corrections move against it. This transition from a 5-wave push to a 3-wave dip creates a recognizable Elliott Wave reversal pattern.
- Strength Indicators: Higher volume and momentum usually signal impulses; lower activity often marks corrections.
By practicing these observations, you start to see where you are in the cycle, helping you avoid emotional trading decisions.
Elliott Wave Time Analysis
Beyond just the shape of waves, time plays a key role. Elliott Wave time analysis suggests that the length of impulse vs corrective waves often follows proportional relationships. For example:
- Impulse waves can last much longer, especially Wave 3 (the strongest move).
- Corrections usually take less time but can still stretch out in sideways or zig-zag formations.
- Fibonacci ratios (like 38.2% or 61.8%) often help estimate how long corrections might last compared to impulses.
This time perspective adds another layer of insight—you’re not only asking “what wave am I in?” but also “how long might it last?”
Why You Must Learn to Differentiate Impulsive & Corrective Waves?
Because knowing the rhythm saves you from emotional whiplash. It keeps you from panic-selling at the bottom or buying into hype at the very top.
Corrections aren’t something to fear—they’re part of the natural cycle. Once you see that, you stop reacting and start observing.
If you are serious about your trading and want to upgrade your skills, then enroll in our Elliott Wave Mentorship now and get personalized guidance and one-to-one learning from the market experts.
Final Thoughts
Impulse and corrective waves are simply the market breathing in and out. They mirror human psychology—optimism, doubt, excitement, and fear—all playing out on price charts.
You won’t be able to call every wave perfectly, and you don’t have to. The real win is staying calm, understanding the cycle, and knowing when it’s time to ride the wave or step back and wait.
The market’s rhythm isn’t random—it’s just human nature in motion.
Before investing capital, invest your time in learning Stock Market.
Fill in the basic details below and a callback will be arranged for more information: