
Day traders require to study a lot of charts, graphs, patterns for carrying out a technical analysis of the stock to make a profit on their trades. Traders employ various Intraday Trading Indicators to gain information such as price movements, price trends, which form a part to learn technical analysis of stocks.
Intraday traders make money by harnessing the stock market volatility.
The stock market prices go up and down every day, and traders need these Intraday trading indicators to make assumptions about the price trends, volume trends of a certain stock.
Top Intraday Trading Indicators
If you are the one who often wonders how to select stocks for intraday, then here is one of the parameters that make your journey simpler. Intraday trading indicators help you in defining your strategy and in determining the right entry and exit point.
These indicators help an intraday trader to grow a better understanding of the market conditions. Intraday indicators, thereby, assist a trader in planning their trading strategy accordingly.
Learn more about Intraday Trading Strategies.
We discuss some of the most common Intraday Trading Indicators :
1. Moving Average Convergence Divergence
Moving Average Convergence Divergence is a momentum indicator and is one of the most insightful Intraday Trading Indicators that helps traders, analysts about an imminent reversal in trend.
The indicator shows a comparison between two exponential moving averages of a specific stock’s price. There are two moving averages of different periods, one of 26 days and the other moving average is 12 days.
MACD is obtained by subtracting the two moving averages of the stock prices. The resulting MACD assists in plotting the MACD line.

Further, a 9-day EMA called the Signal Line is plotted. An increase in MACD spread is indicative of a rise in stock price, and a decrease in the MACD value tells that the prices of a certain stock are falling.
In case the MACD line crosses above the Signal Line, it automatically sends a “Buy Signal,” which tells that the time is right to purchase the stock.
Similarly, it sends a “Sell Signal” when the MACD line falls below the signal line. A “Sell Signal” alerts the intraday trader to sell the stock.
But MACD is a lagging indicator thus, it is good to use it in combination with other leading indicators to get better results.
By the way, do you know how intraday trading works? You should learn about it.
2. Bollinger Bands
Developed by John Bollinger, the widely acclaimed financial analyst, Bollinger Bands is a technical analysis tool that helps traders ascertain whether the stock is in an overbought or oversold condition.
The Bollinger Bands consist of 3 trendlines – the upper band, the lower band, and the Simple Moving Average line (SMA). Usually, the stock prices tend to stay between the two price bands.

Also, Bollinger Bands reveal a market’s volatility.
The wider the bands are, the more volatile the market is. And, narrow bands indicate a lesser volatile market.
When the stock prices are closer to the upper band, the market is believed to be overbought, and the market is oversold when the prices move closer to the lower band.
The reason Bollinger Bands indicator has risen to be one of the go-to indicators among analysts is its unrivaled accuracy of nearly 80%.
3. On-Balance Volume
On-Balance Volume is one of the classic Intraday Trading Indicators that uses volume flow to predict the price movement of a stock.
On-Balance Volume, created by Joseph Granville, also has the distinction of being among the earliest indicators that helped traders measure positive and negative volume flow.
The OBV indicator is cumulative by nature, and having its actual value is not necessary.
 OBV is employed by traders, analysts as a tool to confirm stock price movements. The indicator tends to help traders to identify the perfect opportunity to buy stocks by going against the current trend.
The value of OBV is obtained by aggregating the volume on up days to measure the purchasing pressure and subtracting the volumes on down days to get an idea of the selling pressure.
4. Relative Strength Index Indicator
Relative Strength Index Indicator (RSI) is a momentum indicator that depicts the strength of a stock price. The Relative Strength Index Indicator is often employed by analysts to check the demand and supply of stock.
In other words, this indicator measures the speed of stock price movements. The indicator has an index range of 0 to 100. When the indicator displays a reading of above 70, this points towards an overbought market.
On the contrary, an RSI reading below 30 is indicative of an oversold market.
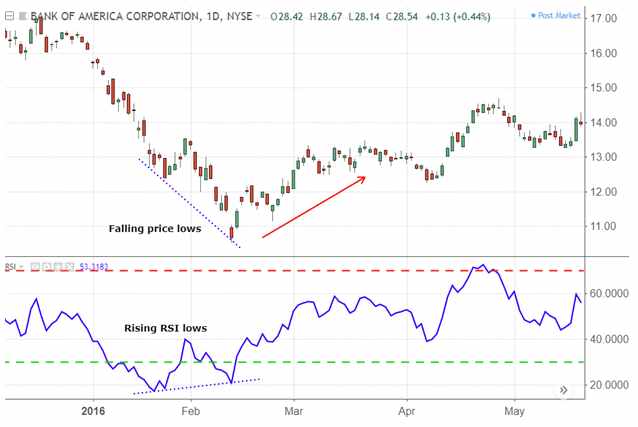
Analysts make use of the RSI indicator to predict a reversal in a particular trend.
The default setting at 30 and 70 generates RSI indicator buy and sell signals thus making it easier to open and close positions in intraday and other short-term trades.
5. Stochastic Oscillator
Stochastic Oscillator is one of the top Intraday Trading Indicators that serves the purpose of comparing the closing price of certain security to its prices ranging over specified time periods. This indicator, instead of measuring the price or volume, tracks the momentum of stocks.
As the momentum of a stock tends to move earlier than the price of a stock.
Just like the RSI, the Stochastic Oscillator also is a range-based indicator and has a range of 0 to 100.
 Similarly, this indicator is useful in ascertaining whether the stock is being bought at a price higher than its real value (overbought conditions) or the stock is in an oversold condition.
A reading of and above 80 depicts overbought market conditions, and readings of 20 and lower tell of an oversold market. The stochastic oscillator is comparatively slower and yet accurate than the Relative Strength Index Indicator.
6. VWAP
Another famous indicator that is best suited for intraday trading is VWAP. The volume-weighted average price indicator not only tells a trader about the trend and price of security but also the volume involved.
It is best suited for intraday traders and when used with other indicators, such as in a VWAP and EMA strategy, it can be a real gem for a trader.
If the VWAP is below the price, it is the right time for a trader to take a long position. It is when the market is bullish. And when the VWAP is above the price, it is the right time to take a short position.
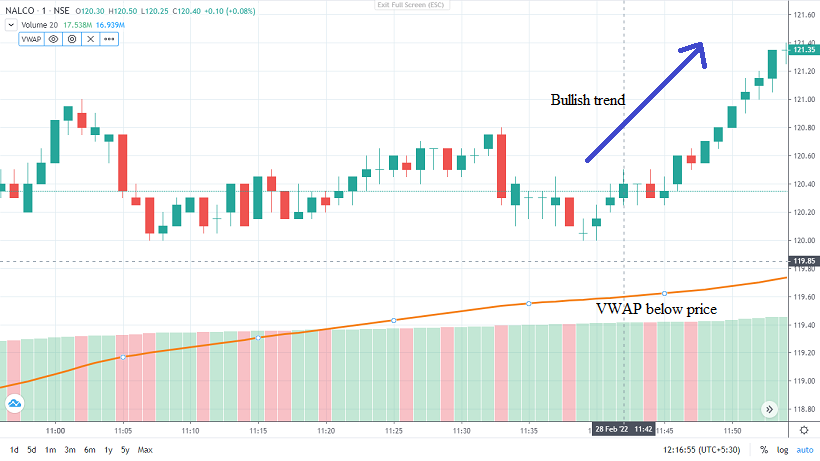
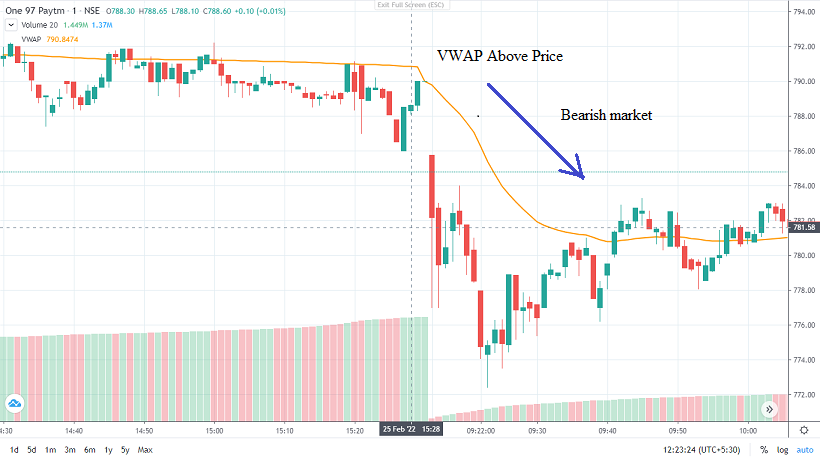
This indicator can help a trader in taking a long or short position and also define the right entry and exit points for a trader.
Conclusion
Intraday trading indicators are used by traders to gain information such as price trends, price movements, which help a trader in making a refined trading decision.
These indicators speak about the potential of trading in a stock.
At the same time, these intraday indicators offer no guarantee about a stock’s performance but help a trader significantly in making the right move at the right time.
MACD Intraday indicator helps a trader in trading decisions through “BUY” and “SELL” signals, while Bollinger Bands tell about the market volatility and whether stocks are in ideal conditions to be bought or sold.
Since day trading is inconsistent and traders opt for any sort of help that they can receive to make profits. Intraday trading indicators certainly deliver on that front.
Stock Pathshala provides an array of stock market courses that you must check out before you delve into the ocean of share market trading.
Before investing capital, invest your time in learning Stock Market.
Fill in the basic details below and a callback will be arranged for more information: