

Markets do not trend quietly for long. At some point, price accelerates, volume expands, and momentum feels unstoppable.
That explosive phase is often Wave 3 in the Elliott Wave cycle.
If you want to understand where the real opportunity lies in a trending market, you need clarity on what is wave 3 of Elliott wave cycle and why traders consider it the strongest move in an Elliott impulse wave pattern.
What Is The Elliott Wave 3 Wave?
Let us explain it clearly.
What is the Elliott wave 3 wave?
It is the third wave in a five-wave impulse sequence, and it always moves in the direction of the larger trend. It cannot be the shortest wave among Waves 1, 3, and 5.
That is a hard rule. This wave is the most powerful component of a motive wave Elliott pattern.
In most markets:
- Wave 3 is longer than Wave 1
- Volume expands
- Momentum indicators show strong readings
- News sentiment turns positive in an uptrend
By the time Wave 3 is in motion, doubt fades. Confidence builds. Retail traders start entering late. Institutions are already positioned.
This is why Wave 3 often travels 1.618 times the length of Wave 1. That Fibonacci relationship shows up repeatedly in stocks, indices, commodities, and even crypto.
Elliot Wave 3 Characteristics
Wave 3 has a personality. Once you see it a few times, you recognize it almost instinctively.
Here are the main Elliot wave 3 characteristics traders watch:
- Strong momentum with wide candles
- Increasing volume
- Minimal deep pullbacks
- Break of previous highs in bullish trends
- RSI often stays above 60 in uptrends
- It is never the shortest impulse wave
There is also a psychological shift. During Wave 1, people doubt the move, especially if it started as a hesitant Elliott wave leading diagonal.
But during Wave 3, the narrative changes. Analysts upgrade targets, and media coverage increases.
Analysts upgrade targets. Media coverage increases.
It feels obvious. That is the trap. It feels obvious only after it has already moved.
How To Identify Wave 3?
This is where most traders struggle.
How to identify Wave 3 before it is too late?
You start by confirming Wave 1 and Wave 2.
Step-by-step approach:
- Identify a clear five-sub-wave structure for Wave 1.
- Wait for a corrective Wave 2 that retraces but does not break the start of Wave 1.
- Watch for a strong breakout above Wave 1 high.
- Confirm momentum expansion.
For example:
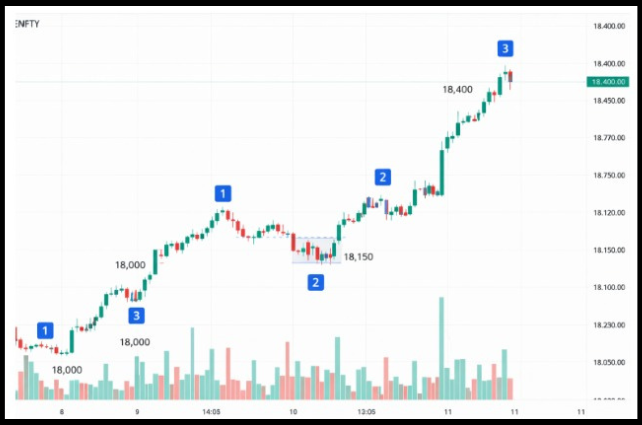
Suppose NIFTY climbs from 18,000 to 18,400 in five clear, smaller pushes. That structure often signals the development of Wave 1.
Then the index cools off and retraces to 18,150, following the Elliott wave ABC correction rules.
Importantly, it does not fall below 18,000. That controlled pullback typically forms Wave 2.
Price pushes above 18,400 with strong, wide candles and visible strength. Volume, meaning the number of shares traded, expands noticeably. That breakout usually signals the start of Wave 3. And Wave 3 is rarely shy.
Think of Wave 3 like a train gathering full speed. At first, only a few traders are on board. Then momentum builds. More participants jump in.
News flows, confidence rises, and suddenly it feels like everyone wants a seat. Once that train gains momentum, it becomes much harder to stop.
In practical terms, traders often plan entries in two common ways:
- Enter as price breaks above the Wave 1 high at 18,400
- Wait for a small pullback after the breakout and then enter
Risk management stays simple and logical. The stop loss typically goes below the Wave 2 low at 18,150. If the price falls below that level, the structure is invalid.
But here’s the key reminder: don’t ignore volume. A true Wave 3 usually shows strong participation. If price breaks out but volume stays weak, the move may lack conviction.
High volume confirms that buyers are committed, not hesitant.
How Much Does Wave 3 Retrace?
Here is a common question. How much does Wave 3 retrace?
Wave 3 itself does not retrace deeply while it is forming. It usually shows shallow pullbacks of 23.6 percent or 38.2 percent internally.
But in terms of projection, Wave 3 often extends:
- 1.618 times Wave 1
- Sometimes 2.618 is in strong trends
Let us look at a quick table for clarity:
| Wave | Typical Behavior |
| Wave 2 | Retraces 50 to 61.8 percent of Wave 1 |
| Wave 3 | Extends 1.618 times Wave 1 |
| Internal Pullbacks | Often shallow 23.6 to 38.2 percent |
If Wave 3 starts retracing deeply and overlapping Wave 1, something is wrong.
Once Wave 3 completes and Wave 4 consolidates, the final move to watch is the Elliott wave 5 length to identify where the overall trend will eventually exhaust.
Real Trading Scenario
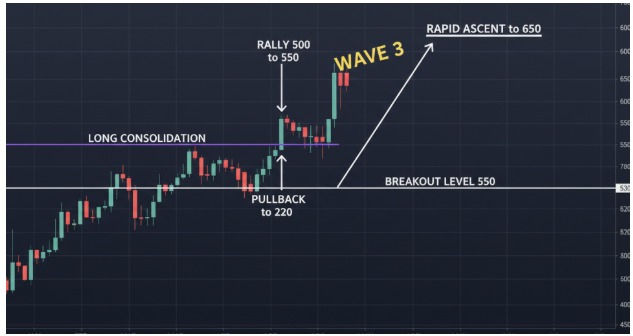
Consider a stock breaking out of a long consolidation. It rallies from 500 to 550. Pulls back to 520. Then breaks 550 and quickly runs to 650.
That 550 to 650 stretch is likely Wave 3.
Notice what happens:
- Pullbacks are small
- Buyers step in quickly
- News turns positive
A practical stop would sit below 520. Risk is defined. Reward expands.
This is why traders love Wave 3. Risk is controlled. Momentum supports you.
Risk And Psychology Behind Wave 3
Here is the irony. Wave 3 feels safe because it is strong. But entering too late can hurt.
If you chase after a huge rally, your stop becomes wide. Risk increases.
Smart traders:
- Enter early on the breakout
- Trail stops as price expands
- Avoid adding at extended levels
Wave 3 is powerful. But discipline still matters.
Understanding what wave 3 of the Elliott wave cycle is.
It is not about memorizing rules. It is about reading structure, momentum, and crowd behavior together.
When you spot it early, it can define your entire quarter.
Conclusion
Wave 3 is where trends prove themselves. It carries strength, conviction, and momentum that often define the entire move.
When structure, breakout, and volume align, that is usually your signal. But timing matters.
Enter early, manage risk, and avoid chasing extended rallies. Understand Wave 3 well, and you stop guessing. You start trading with structure, clarity, and far more confidence.
FAQs
Q1: What Is The Elliott Wave 3 Wave In Simple Terms?
Ans: It is the strongest trending wave in a five-wave structure. It moves in the direction of the main trend with high momentum and volume.
Q2: How To locate Wave 3 Accurately?
Ans: Confirm Wave 1 and Wave 2 first. Then look for a strong breakout above Wave 1 high with expanding momentum and shallow pullbacks.
Q3: How To Calculate Wave 3?
Ans: Wave 3 is typically calculated by projecting a Fibonacci extension of Wave 1 from the end of Wave 2, most commonly 1.618 times the length of Wave 1.
Want to master Wave 3 with real chart examples and step-by-step guidance?
Join our classes in stock market today to turn these technical rules into confident, profitable trades!
Before investing capital, invest your time in learning Stock Market.
Fill in the basic details below and a callback will be arranged for more information:


