
Imagine you plot your support and resistance levels and your entry looks perfect, but then the price blows right through the level like it doesn’t exist. Often, the problem isn’t the level; it’s the timeframe you drew it on.
One question that pops up constantly in trading circles is: which time frame is best for support and resistance?
Selecting the best time frame depends on your trading style, risk tolerance, market conditions, and preferences. The right choice transforms shaky setups into reliable edges.
Let’s explore this topic in simple terms with the help of real trade examples.
Understanding Support And Resistance
Support and resistance levels are important instruments in technical analysis that help traders make wise choices.
Use these levels to plan your entry, exit, and stop-loss and indicate potential price reversals or continuations.
- Support Levels: At these points, the price usually stops declining and starts to rise again. Buyers step in here and push the price back up.
- Resistance Levels: At these points, the price typically reaches a ceiling and declines. Sellers overwhelm buyers here and push prices back down.
- Time Frame Significance: Longer timeframe levels carry more weight than shorter ones. Orders build up as more traders keep an eye on these levels, raising the possibility of significant bounces or rejections.
- High-Probability Setups: They can provide setups with greater chances of success when support and resistance levels are paired with the appropriate time period. It’s crucial to select the right chart for your approach.
Once you understand how to read these levels, your trade accuracy goes up. Match the right level to the right timeframe, and you’ll start finding better trade setups.
Time Frame Considerations for Support and Resistance
The timeframe you choose directly affects how reliable your levels are.
To balance accuracy and reactivity, different trading methods call for different chart timeframes.
|
Trading Style |
Time Frame to Draw Support & Resistance | Time Frame to Use for Entry | Chart Suggestion |
| Scalper | 15M / 30M | 5M |
Show S&R zones on 15M chart; highlight entry points on 5M chart |
|
Day Trader |
1H / 4H | 15M / 30M | Mark intraday swings on 1H/4H chart; zoom in on 15M/30M for precise entries |
| Swing Trader | Daily | 4H / 1H |
Draw major swing highs/lows on the Daily chart; plan entry on 4H/1H |
|
Position Trader |
Weekly | Daily |
Highlight long-term support/resistance on the Weekly chart; fine-tune entry on the Daily |
The concept is straightforward: larger time periods offer strength and dependability, while shorter time frames offer accuracy.
Additionally, longer time periods aid in removing market noise, providing you with more precise levels on which to base your trades.
Best Time Frame To Draw Support And Resistance For Intraday
Short-term charts are more useful for intraday trading, especially when identifying intraday support and resistance. A lot of traders note intraday levels on 15- or 30-minute charts.
During market hours, these charts aid in capturing the fluctuations in prices.
For instance:
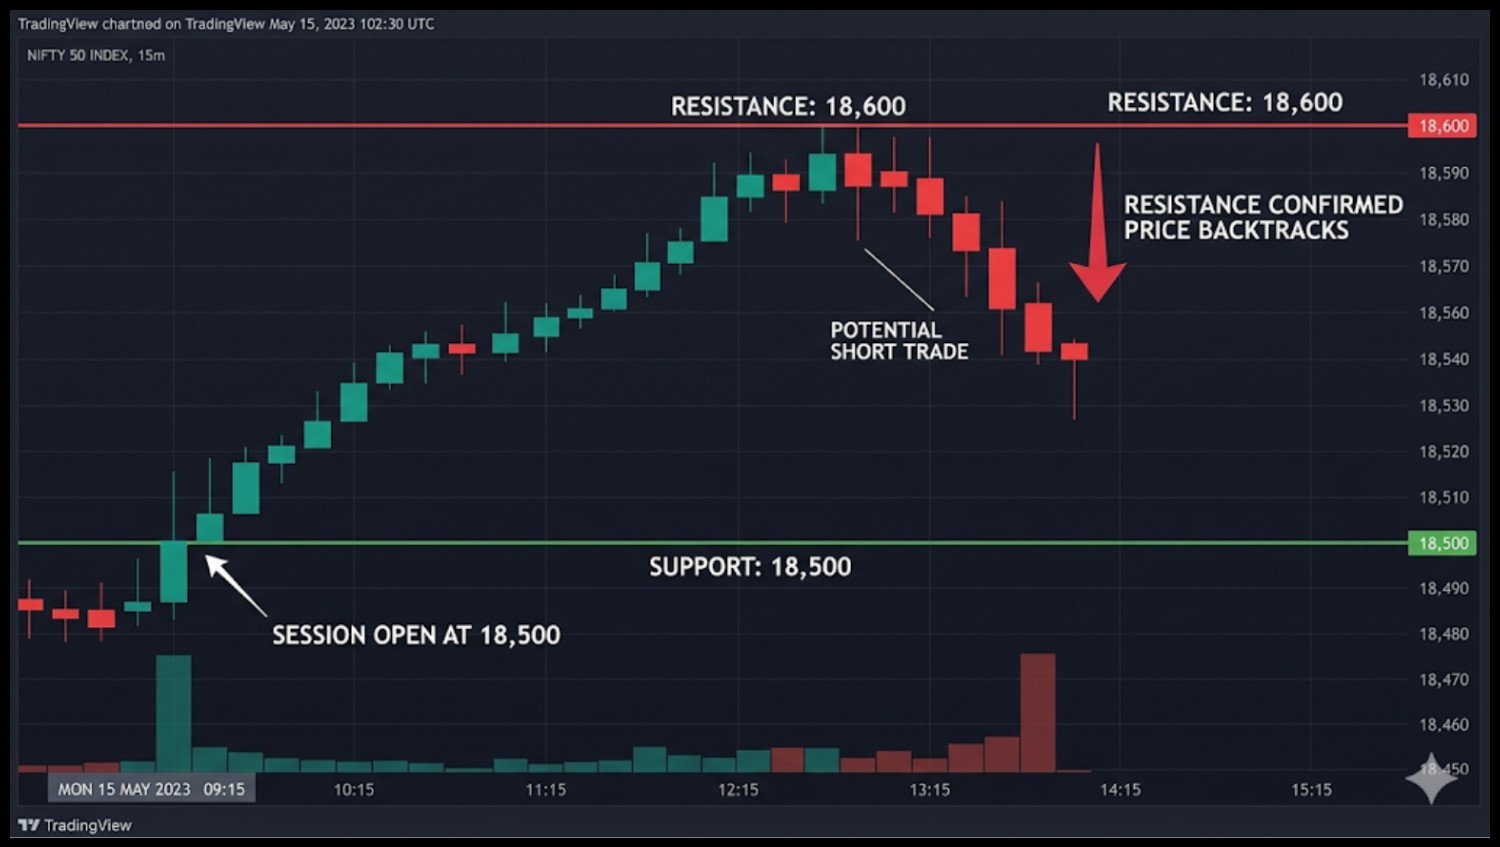
The 18,600 level becomes a resistance point for that session if the Nifty begins at 18,500 and rises to 18,600 before backtracking.
This is actionable for short-term trades when plotted on a 15-minute chart.
- 5-minute charts: Great for scalping, but very sensitive to minor price fluctuations.
- 15-minute charts: Balance between noise and meaningful levels.
- 30-minute charts: Capture intraday swings and give stronger levels.
Your desired reaction time and noise threshold will determine which intraday chart is best for you.
It also depends on your approach; swing intraday traders typically adhere to 15 or 30-minute charts for clearer indications, while scalpers may prefer 5-minute charts.
Which Time Frame Is Best To Draw Support And Resistance For Swing Trading?
Capturing movements that last for many days is the goal of swing traders. In this case, stronger levels are more clearly depicted when utilising 4-hour or daily charts.
Shorter time intervals might result in erroneous messages and needless anxiety.
For instance:
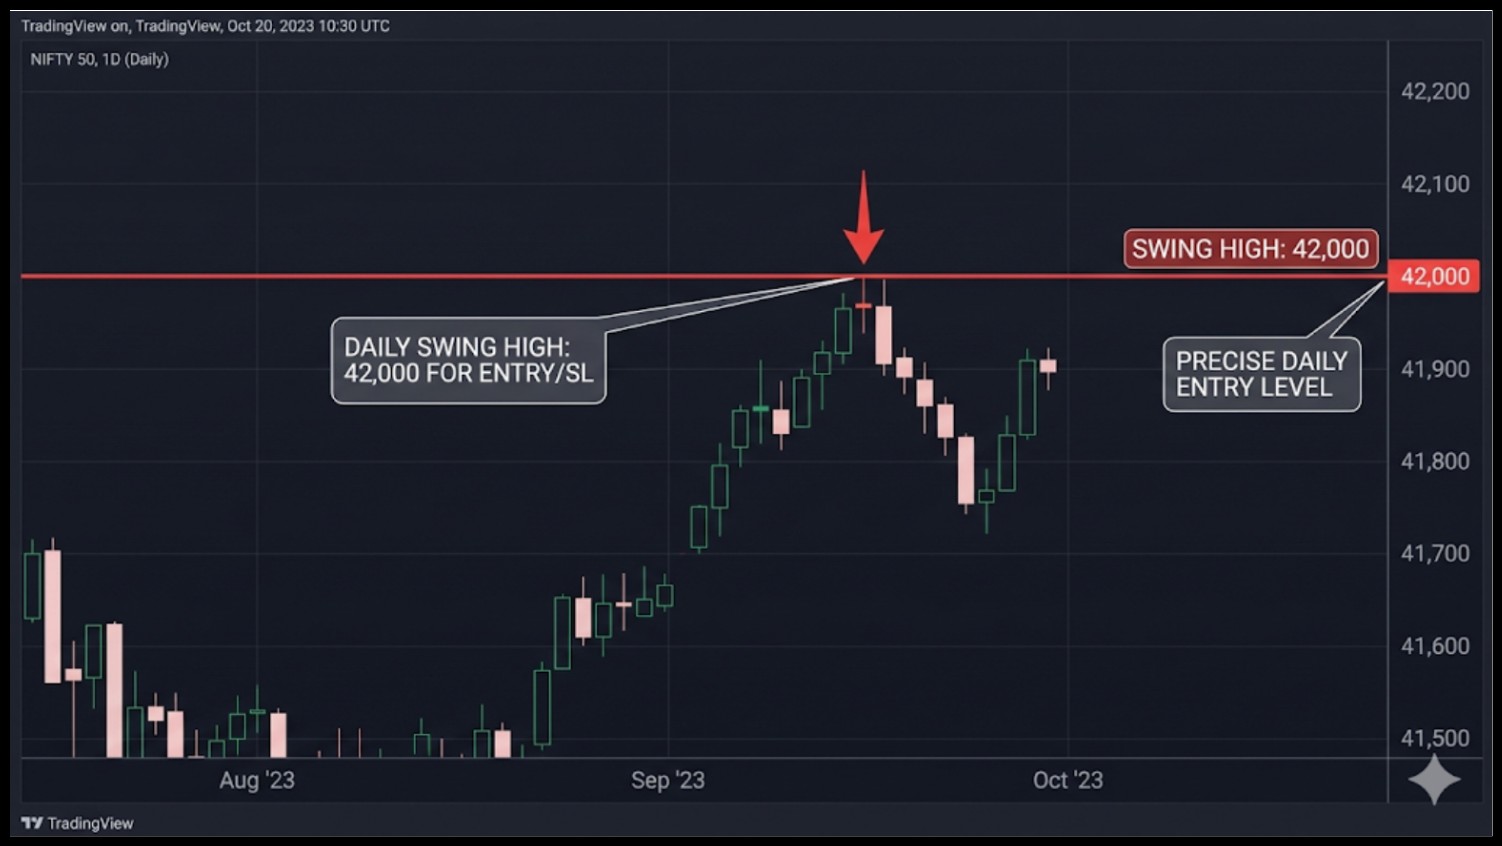
On a daily chart, the Bank Nifty creates a swing high at 42,000. Compared to using a 15-minute chart, using this level for entry and stop-loss planning enhances the likelihood of a successful trade.
Swing traders can concentrate on significant support and resistance since longer time frames inherently filter out market noise.
Combining Multiple Time Frames For Support And Resistance
Combining several time periods is a clever strategy. This enables you to record the accuracy of short-term charts as well as the strength of long-term levels.
Example:
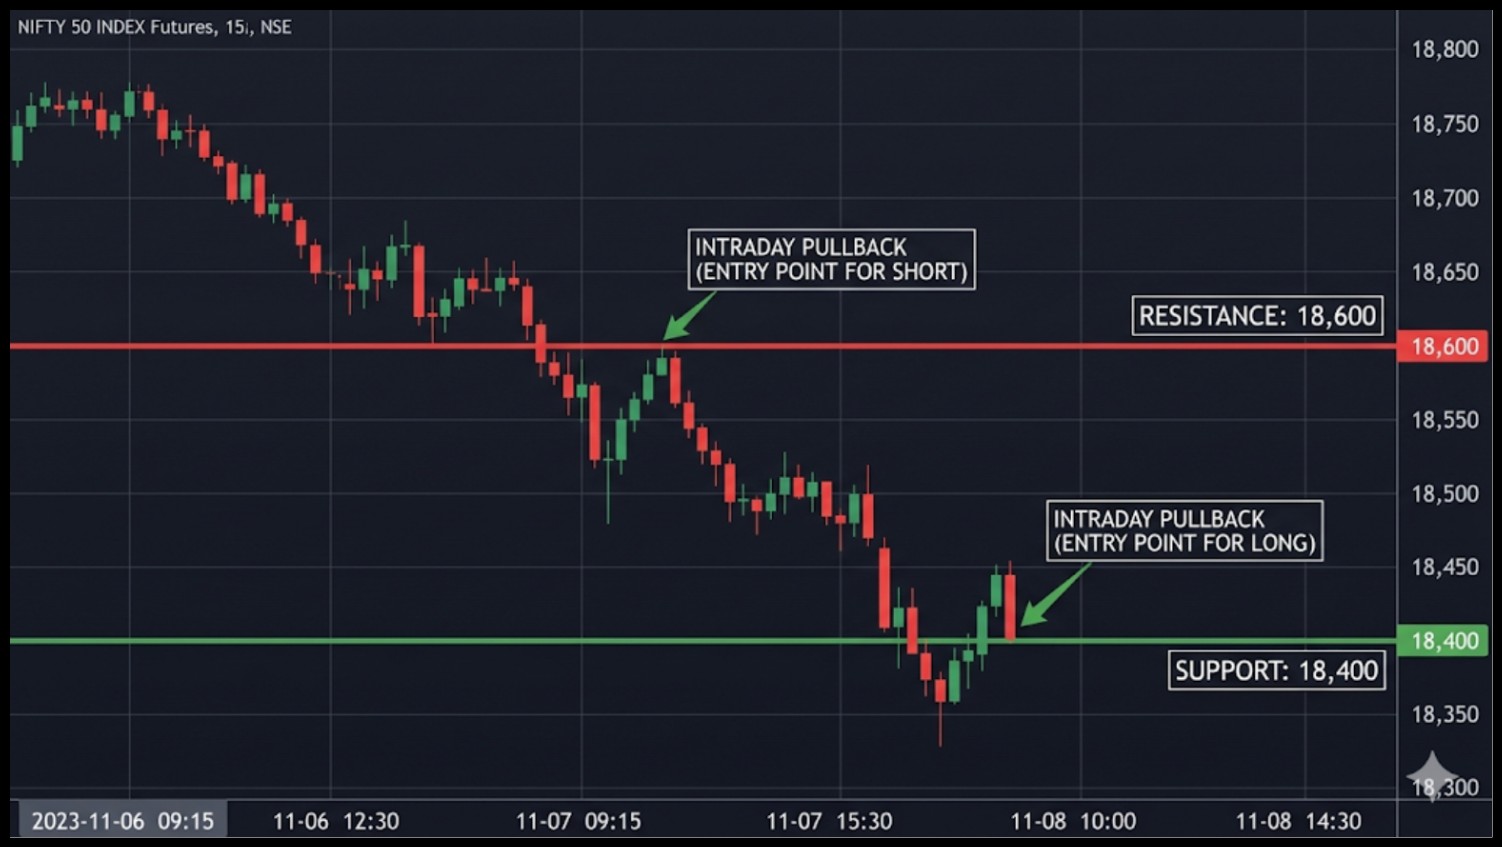
- Look at daily charts to identify resistance at 18,600 and good support at 18,400.
- To locate intraday pullbacks close to these levels for accurate entry, go to 15-minute charts.
This approach keeps your entry sharp and your trade direction aligned with the bigger trend. It also helps you avoid false breakouts and gives you much cleaner risk management.
Indicators and Confluence
While price action is important, some indicators can confirm support and resistance levels.
These indicators help traders filter out false signals and make more certain transactions by acting as a second layer of confirmation.
Well-liked options include:
- Moving Averages: 50 EMA and 200 EMA frequently serve as dynamic resistance or support.
- Pivot Points: Determine possible levels of reversal for intraday trading.
- Bollinger Bands: Assist in identifying regions with excessively high prices.
When several components come together at the same level, resistance and support become much more dependable. This idea, known as confluence, is what distinguishes high-probability trades from ordinary setups.
The Significance of Confluence:
- Strength is added by a horizontal level that lines up with a moving average.
- Attention is drawn to psychological round figures like 18,000 or 18,500.
- Reliability is increased when Fibonacci levels coincide with support or resistance.
- Its significance is confirmed by recurring price changes in the same area.
Practical Example:
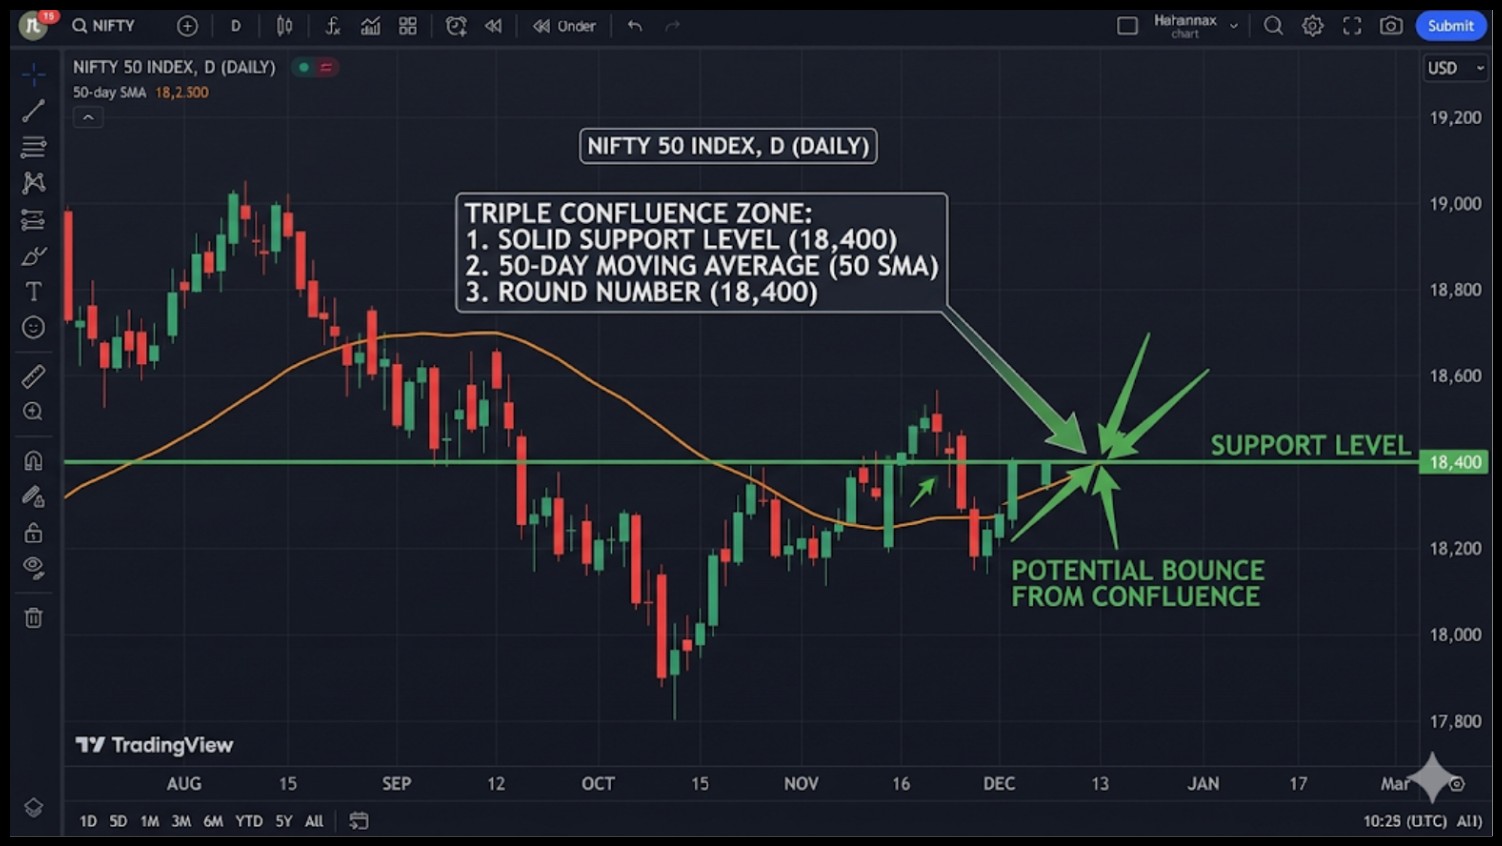
A triple confluence occurs when the Nifty has solid support at 18,400 on the daily chart, and that level also coincides with the 50-day moving average and a round number.
This raises the likelihood of a bounce and makes the level far stronger than a straightforward support line.
What Is The Best Strategy For Support And Resistance?
Understanding the levels is only the beginning when it comes to resistance and support. Planning your trades around them to maximise probability and minimise risk is the true talent.
Waiting for confirmation before making a deal is the recommended course of action:
- Identify the level of the chosen time frame.
- Hold off until the price gets close to the level.
- Check for candlestick confirmation, such as engulfing patterns or pin bars.
- Set the stop-loss just above the level and aim for the subsequent critical level.
Example:
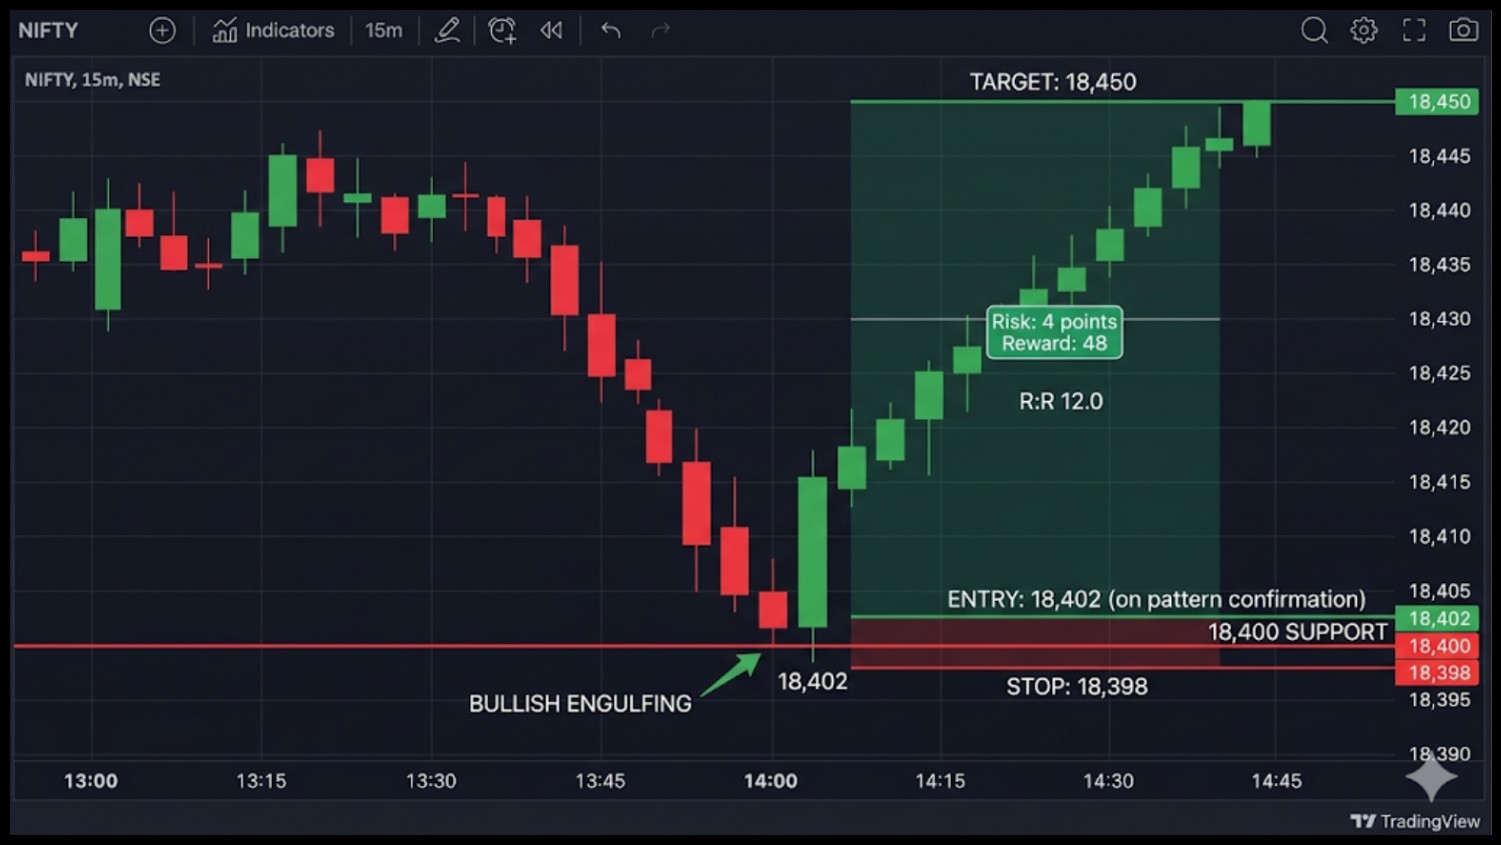
Nifty support at 18,400. Price dips to 18,402, forming a bullish engulfing candle on a 15-minute chart.
Enter long with a stop at 18,398 and target 18,450. This aligns your risk with a clear support level.
Common Mistakes Traders Make
Even experienced traders get these levels wrong sometimes. This frequently occurs when levels are derived from insufficient data, rendering them untrustworthy.
Common pitfalls include:
- False breakouts occur when significant trades are made within an inadequate time window.
- disregarding volume, which verifies level strength.
- Reliability is decreased when levels are drawn from insufficient data points.
- Don’t assume that the price will end at precisely 18,400. Consider it a range of 18,390 to 18,410. Premature entry and overly tight stop-loss placement are avoided using trading zones rather than lines.
- To prevent analysis paralysis, limit the number of S&R lines on any chart to two or three critical levels.
If these mistakes are corrected, your transactions will be more precise and lucrative. It also increases confidence, which helps you make better decisions while under pressure.
Real-World Example
Seeing an actual trade setup makes it much easier to understand how support and resistance really work in the market.
Let’s walk through a practical intraday trading example where entry, stop-loss, and target levels are defined using multiple timeframes.
Situation: Nifty intraday transaction
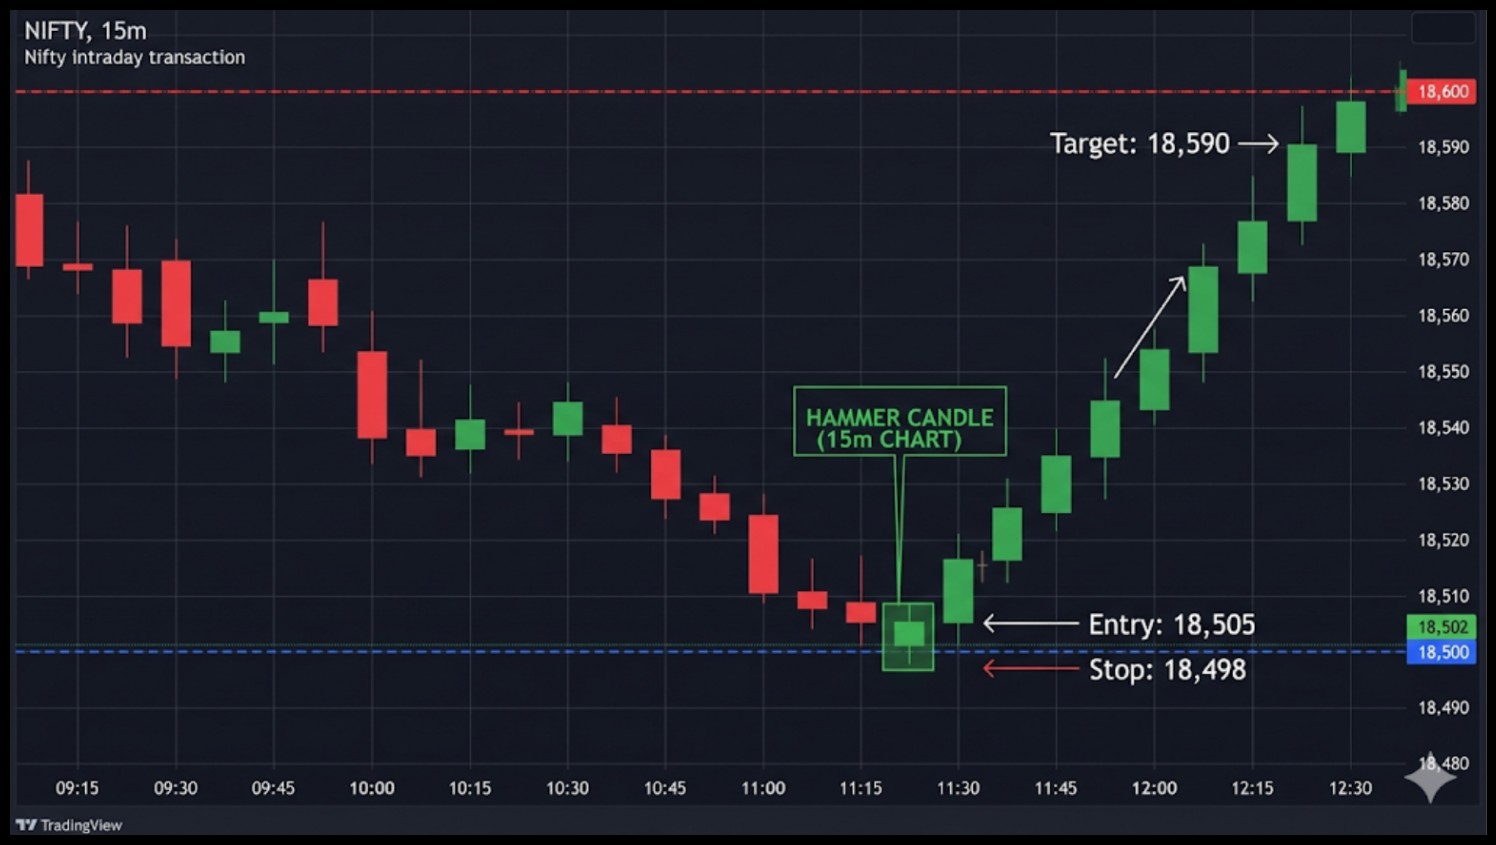
- Resistance at 18,600 and support at 18,500 are seen on the daily chart.
- Price tries to support at 18,502 and creates a hammer candle on a 15-minute chart.
- Target: 18,590; Entry: 18,505; Stop: 18,498.
This approach combines candlestick confirmation, the best time frame selection, and a multi-time-frame technique for a high-probability trade.
Where Should Beginners Start?
Starting your trading journey can be exciting, but rushing into short-term charts often creates confusion and emotional decision-making.
A structured approach, beginning with longer timeframes, can help build confidence and clarity.
- Jumping into 5-minute charts before you understand the bigger picture almost always leads to bad trades.
- Begin with the daily chart to determine levels of support and resistance. It filters out background noise and highlights clear, reliable price zones.
- After identifying key levels on the daily chart, use the 4-hour or 1-hour charts to plan precise entries. This approach allows you to see the bigger picture before focusing on execution.
- Starting with the daily chart slows you down in a good way; you see the full picture before rushing into a trade.
As you get comfortable, you can zoom into shorter charts for your entry, but the daily chart should always be your starting point.
Building this foundation ensures that your decisions are driven by strategy rather than emotion.
Conclusion
Finding trustworthy support and resistance levels requires careful consideration of the timeline.
A well-selected chart makes trading decisions more organised by reducing market noise and providing a clearer picture of price movement.
Since it filters out short-term oscillations and exposes strong support and resistance zones, the daily chart is frequently utilized initially.
The 4-hour chart aids in refining entrances and monitoring intermediate price movements once these levels have been determined.
Traders then switch to shorter periods, such as the 1-hour chart, for exact entry and exit timing.
Traders are able to make more certain and knowledgeable selections because of this top-down strategy.
FAQs
Q1: What time period works best for intraday trading support and resistance?
Ans: The best charts for identifying actionable levels in intraday trades are those with a duration of 15 or 30 minutes. They assist traders in identifying dependable entry and exit zones by striking a balance between noise and clarity.
Q2: Can intraday trades be made using weekly charts?
Ans: Weekly charts provide long-term levels, but they are too broad for precise intraday entry. These levels have the potential to affect intraday price movement by serving as potent support or resistance zones.
Q3: Which indication works best for resistance and support?
Ans: Important levels of support and resistance can be confirmed using moving averages, pivot points, and Bollinger bands. Stronger confirmation is sometimes obtained by combining many signs rather than depending only on one.
Before investing capital, invest your time in learning Stock Market.
Fill in the basic details below and a callback will be arranged for more information: