
If you trade intraday, options, or futures and your chart looks like a rainbow from too many indicators, understanding the 50 EMA Meaning can simplify your decision-making.
The 50 EMA (50 Exponential Moving Average) represents the average price of the last 50 periods, giving more weight to recent prices, and helps clearly identify the market’s upward or downward trend without cluttering your screen with 10 different indicators.
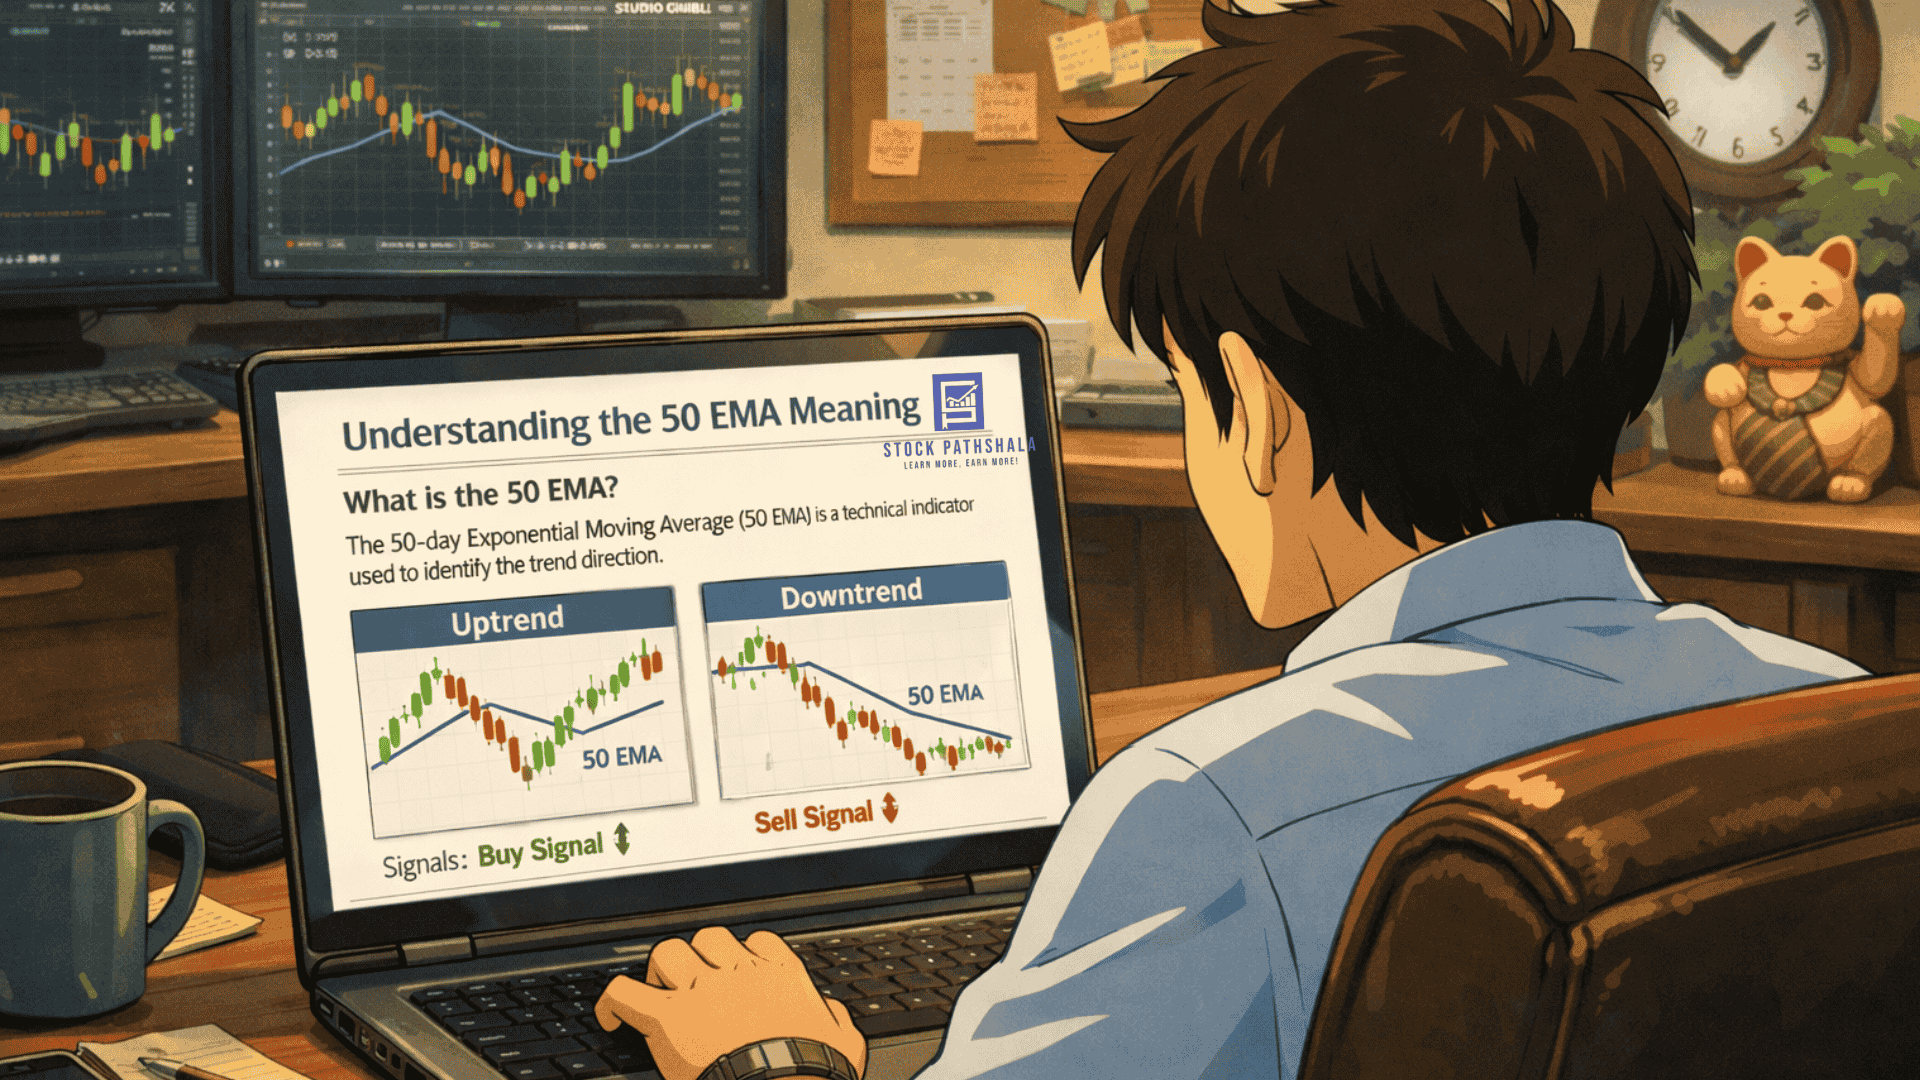
Now, what is the 50 EMA in the stock market?
It is a line on the chart that shows the average price of the last 50 candles, giving more importance to recent prices through a specific moving average calculation.
For example:
- On a daily chart = last 50 trading days
- On a 1-hour chart = last 50 hours
- On a 15-minute chart = last 50 candles (12.5 hours)
50 EMA Strategy
The 50 EMA Strategy is a simple trend-following setup that helps traders identify momentum shifts using the 50-period Exponential Moving Average.
It works well in trending markets and is widely used in stocks like Reliance Industries and indices such as Nifty 50.
This strategy focuses on price crossovers and confirmation candles to capture high-probability entry points.
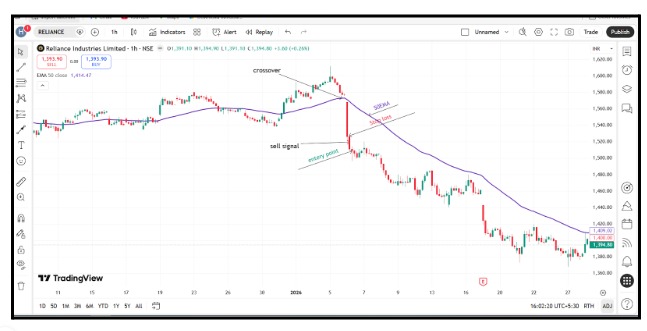
50 EMA Sell signal
Above is a reliance graph. Traders who caught this opportunity with the 50 EMA were able to get 160 points on a sell signal.
Here’s exactly how it works:
Step 1: Look For The Crossover
First, watch for the price crossing the 50 EMA.
When the price moves from above the 50 EMA to below it, it signals a potential shift from bullish to bearish conditions. This crossover suggests that sellers are gaining control, and the prior uptrend may be weakening.
Step 2: Confirm The Signal
One candle breaking below isn’t a signal yet. You need to wait.
Look at the next candle after the break. If that candle continues going downward and doesn’t touch the 50 EMA line again, that’s your sell signal.
On Reliance, the price broke below around 1,410.
Step3: Confirmation:
The next candle formed downward without returning to touch the 50 EMA. It indicates the sell signals
Step4: Enter
After the sell signal is created, wait until you see that the next candle is going downward, and that’s your entry point
Step5: Stop Loss & Trail Profits.
Place stop loss below the last significant low as a buyer, above the last significant high as a seller. Once you’re up/down 70-80 points on Nifty, start trailing your stop loss. Lock in 50% profit.
Let the remaining 50% ride with a trailing stop.
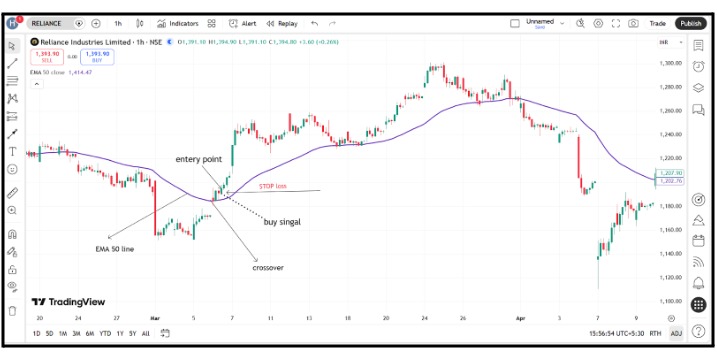
50 EMA Buy Signal
Above is a reliance graph. Traders who caught this opportunity with the 50 EMA were able to get +100 points on a buy signal.
Here’s exactly how it works:
Step 1: Look For The Crossover
First, watch for the price crossing the 50 EMA.
When the price moves from below the 50 EMA to above it, it signals a potential shift from bearish to bullish conditions. This crossover suggests that buyers are gaining control, and the older downtrend may be weakening.
Step 2: Confirm The Signal
One candle breaking above isn’t a signal yet. You need to wait.
Look at the next candle after the break. If that candle continues going upward and doesn’t touch the 50 EMA line again, that’s your buy signal.
On Reliance, the price broke above around 1,390.
Step 3: Confirmation
The next candle formed upward without returning to touch the 50 EMA. It confirms the buy signal is real.
Step 4: Enter
After the buy signal is created, you see that the next candle is going upward, and that’s your entry point.
On Reliance, entry was around 1,390.
Step 5: Stop Loss & Trail Profits
Place stop loss above the last significant high as a buyer, below the last significant low as a seller. Once you’re up 70-80 points, start trailing your stop loss. Lock in 50% profit. Let the remaining 50% ride with a trailing stop.
How Different Traders Use the 50 EMA?
| Trading Style | Timeframe Used | How 50 EMA Is Used |
| Intraday | 1-min to 15-min | Trend filter & dynamic support/resistance |
| Swing | 1H to Daily | Identify medium-term trend & pullback entries |
| Positional | Daily to Weekly | Confirm major trend direction |
Why 50 EMA Not Work?
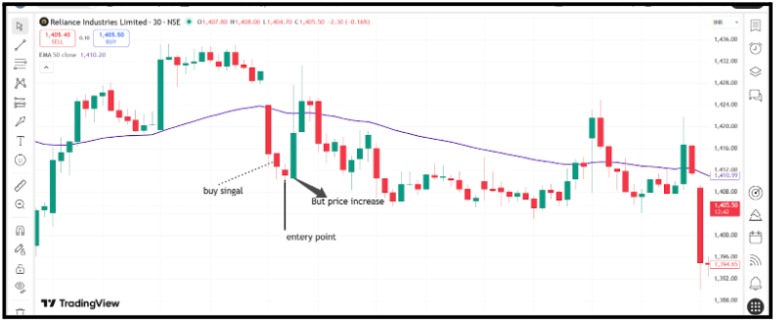
The Reliance Chart: A Perfect 50EMA Setup That Failed
Look at the blue 50 EMA line on this chart.
The market was in an uptrend until a strong red candle appeared, signaling a potential downtrend. The price then dropped sharply, with the next candle not touching the 50 EMA, for many traders, as it is considered a strong sell signal.
The next downward candle was made at its entry point.
But instead of the price going down, the price went UP 20-21 points.
So, 50 EMA is a tool, not a fortune teller. It shows you the market direction. But it doesn’t predict what happens next.
You don’t just enter on the signal. You check the market condition
How To Trade With 50 EMA?
Instead of falling in love with one indicator (like 50EMA ), experienced traders build context.
They combine the EMA with:
- Price action
- Volume
- Support and resistance
- Market structure
- Risk management
- Momentum tools like RSI or VWAP
- EMAs like 20,30,200
Many traders also watch the 20 and 50 EMA crossover to understand short-term momentum shifts within a broader trend.
That’s why seasoned professionals don’t depend on just one line on the chart.
They use a different indicator for different markets.
This way, even if the 50 EMA shows false trend signals. You can cross-check with other signals for confirmation, but be careful, my friend, not to use 10 different indicators at once for verification.
You will get confused.
Remember, in the beginning, trading isn’t about making money first, “ it’s about protecting capital”.
If you stay in the game long enough, profits have room to show up.
Conclusion
EMA is not magic. False in sideways markets because price moves without a clear trend and keeps crossing the EMA, creating false signals.
The 50 EMA becomes useless when the price moves in a range (no clear trend), or Sudden News by the RBI or other big authority Can Destroy EMA Signals in Seconds.
So, completely depending on the EMA is not wise.
But ignoring it completely isn’t wise either.
Because, as you saw, it still provides useful information about market behavior.
So, if you’re serious about stock market trading and want to gain mastery over technical indicators, enroll in our Technical Analysis classes and learn directly from experienced market professionals..
FAQ
Q1: For what market EMA 50 work?
Ans: Depends on your trading style. It works for Intraday traders on a 15-minute chart. Swing traders for the daily chart. Positional traders for the weekly chart. plus it works best with Nifty 50, Bank Nifty, and high-volume stocks like Reliance, HDFC, and Infosys.
Q2: Should I use 50 EMA for intraday trading?
Ans: Yes, but not alone. On a 15-minute chart, the 50 EMA works well for identifying the overall trend direction during the day. But for actual entries and exits, combine it with a faster indicator like 9 EMA or VWAP to form a more complete VWAP and EMA Strategy.
Q3: Which is the best timeframe for the 50 EMA?
Ans: There isn’t a single best timeframe for trading; it really depends on your trading style. However, a key rule to remember is that a US50 EMA signal on a daily chart is generally much more reliable than the same signal on a 5-minute chart.
Before investing capital, invest your time in learning Stock Market.
Fill in the basic details below and a callback will be arranged for more information:


