
Markets are rarely a straight shot to the top. They pulse, breathe, pause, and sometimes take a step back before surging again.
That’s where the corrective pattern comes in, a structured way to understand those inevitable pullbacks.
If you’ve ever wondered why prices retreat even in a strong trend, mastering corrective wave patterns gives you clarity and keeps you from jumping in at the wrong time.
What Is The Corrective Pattern Of The Elliott Wave?
Let’s start simple. The Elliot wave corrective pattern is the phase where the market takes a breather after an impulsive move.
To get the full picture of market cycles, traders often compare Impulsive vs Corrective Wave behavior to see who is currently in control.
It is usually comprised of three waves, two of which are reversals against the trend, and a smaller reversal.
You may imagine it as a break in a song; the beat is present, but the intensity becomes less before increasing once again.
This is the reason why traders are watching corrective patterns closely; they give hints of where the next big move may begin.
Corrective Wave Patterns Explained
Corrective waves come in a few distinct flavors. Each one has rules and traits that can guide your trades.
Understanding these helps you avoid chasing the market blindly and allows you to spot wave patterns before they fully develop.
1. Zigzag Corrective Pattern
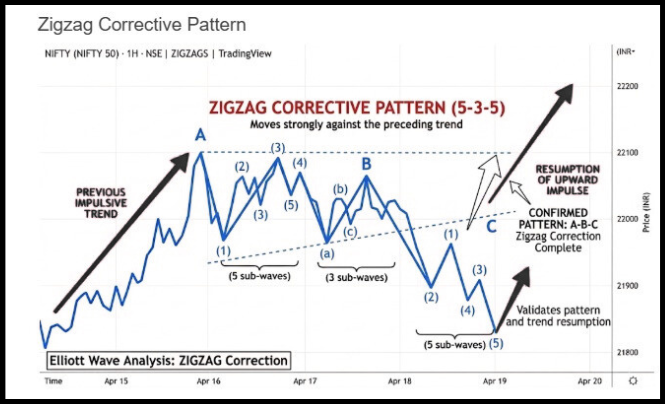
The Zigzag corrective pattern is sharp and aggressive.
- Structure: 5-3-5
- Moves strongly against the preceding trend
- Often signals a quick retracement
Think of a steep drop after a fast rally. Price fixes quickly, and short-run traders have an exit point into the resumption of the main trend.
Using an Elliott Wave forecast can help you determine if a zigzag is just a minor dip or a deeper trend change.
As an illustration, in a bullish development, Wave A in a zigzag pulls down, Wave B rebounds, and Wave C extends.
Interestingly, a zigzag is also the internal building block for the Elliott Wave leading diagonal, a pattern that appears at the start of new trends and often confuses traders because of its corrective appearance.
2. Flat Corrective Pattern
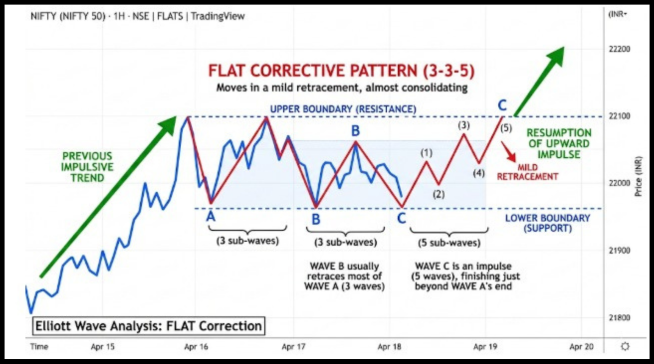
The Flat corrective pattern is more sideways.
- Structure: 3-3-5
- Moves in a mild retracement, almost consolidating
- Signals a temporary pause rather than panic
Traders often see flats as a chance to hold positions rather than exit. An Elliott Wave flat correction indicates the market isn’t ready to drop significantly yet; it is just taking a breather.
You would also find that Wave B nearly copes with Wave A to form a near horizontal channel before the completion of Wave C that finalizes the correction.
3. Triangle Corrective Pattern
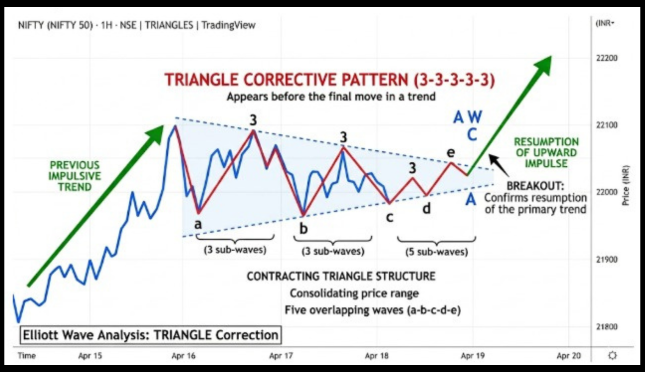
Triangles are rarer but critical.
- Structure: 3-3-3-3-3 (five overlapping waves)
- Appears before the final move in a trend
- Indicates contracting price swings
Triangles are tricky but rewarding. They often form in Wave 4 of an impulsive move or as Wave B in a larger correction.
Traders use them to anticipate breakouts because the narrowing price action almost always ends with a sharp surge.
Zigzag Corrective Pattern vs. Flat Corrective Pattern vs. Triangle Corrective Pattern
| Feature | Zigzag Corrective Pattern | Flat Corrective Pattern | Triangle Corrective Pattern |
| Basic Structure | A B C | A B C | A B C D E |
| Internal Wave Count | 5 3 5 | 3 3 5 | 3 3 3 3 3 |
| Market Personality | Sharp and aggressive correction | Sideways and balanced correction | Contracting or consolidating correction |
| Wave A | Small retracement, usually below the start of Wave A | Mild move against trend | Sideways move |
| Wave B | Often, Wave 2 correction | Often, Wave 4 correction | Moves within tightening range |
| Wave C | Strong continuation in direction of Wave A | Similar size to Wave A | Gradually weaker swings |
| Visual Appearance | Steep pullback | Horizontal or slightly slanted range | Converging trendlines, triangle shape |
| Typical Trader Interpretation | Quick profit booking phase | Market indecision | Consolidation before breakout |
| Common Location | Retraces close to or beyond the start of Wave A | Often, the Wave 4 correction | Usually, Wave 4 or before the final thrust |
| Volatility | High | Moderate | Decreasing over time |
What Is A Corrective Pattern Of Three Waves?
At its core, the corrective pattern of three waves is just a simple retracement structure. It consists of Waves A, B, and C:
- Wave A moves against the trend
- Wave B retraces partially in the direction of the trend
- Wave C completes the correction
To better estimate the depth of these moves, many professionals combine Elliott Wave analysis with Fibonacci retracement levels to identify where Wave C may potentially reverse.
This three-wave structure forms the foundation of all corrective patterns. Whether it’s a zigzag, flat, or triangle, understanding this movement gives traders a framework to anticipate market behaviour.
Using Corrective Patterns in Trading
Here’s how traders use these patterns in practice:
- In a bullish market, you notice a Zigzag corrective pattern forming. Wave A drops sharply. Instead of panic selling, a trader may wait for Wave C to complete before re-entering long positions.
- A Flat corrective pattern is observed during a sideways market. During this time, traders may opt to stock a position instead of following the trends.
- The observation of a Triangle corrective pattern in Wave 4 is a warning that the last impulsive wave may be intense. Traders tend to tighten stops and set a breakout.
Corrective patterns are not just theoretical; they guide real decisions. Recognizing them prevents emotional trades and improves risk management.
Common Mistakes Traders Make With Corrective Patterns
Even well-trained traders often find corrective patterns difficult to handle. Spotting them requires patience and consistent practice.
The following are some common pitfalls to avoid:
- Misreading corrections as trend reversals can lead to early losses.
- Ignoring Wave B retracements often disrupts proper trade timing.
- Skipping Fibonacci levels makes it harder to identify where corrections may end.
- Forcing patterns into price action can result in incorrect setups.
- Neglecting volume and momentum may lead to misjudging market strength.
- Overtrading during corrections increases risk unnecessarily.
- Ignoring multiple timeframes can distort pattern interpretation.
To avoid these mistakes, many traders seek professional Elliott Wave mentorship to refine their wave-counting skills.
Conclusion
The corrective pattern is the market’s way of taking a breather, and knowing how to spot it is essential for every trader.
Whether sharp Zigzags or sideways Flats and narrowing Triangles, every design has a tale.
The knowledge of these structures and the principles of the Elliot wave corrective pattern can make you trade smarter, make decisions on risks, and help you predict the upcoming trend move with a high degree of confidence.
Patterns are not only pauses, but it is an opportunity to be corrected.
So, are you ready to master these charts?
Join our stock market classes and unlock deeper insights into corrective patterns.
FAQs
Q1: What is the corrective pattern of the Elliott wave?
Ans: It is the period when the price reverses itself following a hasty step, and it is typically organized in three waves termed as A, B, and C.
Q2: What is a corrective pattern related to phenomenon three waves?
Ans: It is the basic A B C structure where Wave A moves against the prevailing trend, Wave B retraces part of that move, and Wave C completes the corrective phase.
Q3: How do traders use Zigzag and Flat corrective patterns?
Ans: Zigzags indicate sharp corrections for potential re-entry points, while Flats suggest sideways consolidation and temporary pauses in the trend.
Unlock deeper insights into corrective patterns. Download the Stock Pathshala app for a detailed trading session today!
Before investing capital, invest your time in learning Stock Market.
Fill in the basic details below and a callback will be arranged for more information:


