

Charts don’t fail because they lack patterns. They fail because traders expect certainty from a game built on probability.
That’s where Elliott Wave enters the conversation. Some call it genius. Others call it confusing.
So let’s ask the question properly and practically: Does Elliott wave theory work, or is it just another complicated way to read price charts?
Does Elliott Wave Theory Work In Real Markets?
This is the question most people type into Google after a failed trade. They want certainty.
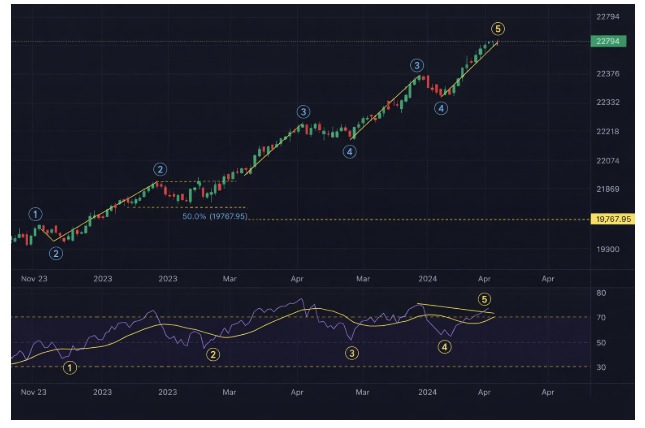
Markets rarely give that. Elliott Wave Theory, developed by Ralph Nelson Elliott, suggests that markets move in repetitive cycles.
Specifically, a complete trend cycle consists of a 5-wave Impulse wave pattern followed by three corrective waves.
These waves reflect crowd psychology. Optimism builds, peaks, fades, and resets.
But theory is one thing. Trading is another.
In trending markets like strong bull runs in NIFTY or Bitcoin rallies, the five-wave impulse structure often appears clearly.
Wave 3 usually extends. Corrections respect Fibonacci retracements like 38.2 percent or 61.8 percent.
However, in choppy sideways markets, wave counts become messy. Multiple valid counts can exist at the same time.
What Is The Success Rate Of The Elliott Wave?
Let’s address this directly. There is no fixed statistical success rate.
Unlike mechanical strategies with backtested numbers, Elliott Wave analysis depends on interpretation. This often sparks the Elliott Wave vs Price Action debate among traders.
Two analysts may label the same chart differently. That subjectivity affects accuracy.
That said, experienced wave traders combine structure with confirmation tools like:
- RSI divergence
- Volume expansion in Wave 3
- Fibonacci extensions near Wave 5 targets
- Break of trendlines during corrections
When combined properly, traders report improved probability setups, often aiming for risk-to-reward ratios of 1:2 or higher.
Here’s a simplified comparison:
| Scenario | Pure Guessing | Wave Based Trade |
| Entry Basis | Emotional | Structure Based |
| Stop Loss | Random | Below Wave 2 or Wave 4 |
| Target | Hope | Fibonacci Projection |
Notice something?
The edge is not prediction. The edge is risk control.
Elliott Wave Rules & Guidelines
Here’s the thing. Not everything in Elliott Wave carries equal weight. Some are hard rules. Others are guidelines.
A rule cannot be broken. For example, Wave 3 cannot be the shortest impulse wave. If it is, your count is wrong.
But when traders say Wave 4 usually retraces 38.2 percent, that is only a guideline. It often happens, yes.
But markets are messy. Sometimes it retraces 23 percent. Sometimes 50 percent.
Confuse the two, and you mislabel charts.
So, how to simplify it?
Well, the Elliott Wave reflects crowd psychology in motion.
Understanding Elliott Wave formation comes down to simplifying it:
- Wave 1: Quiet accumulation, smart money steps in
- Wave 2: Doubt returns, weak hands exit
- Wave 3: Broad participation, strong momentum
- Wave 4: Profit booking, temporary fatigue
- Wave 5: Unbridled optimism, even late buyers rush in. Once this fifth wave concludes, it often sets the stage for a classic Elliott Wave reversal pattern, signaling that the trend is ready to reset.
You can see this on NIFTY during strong rallies.
How Effective Is Elliott Wave Theory In Different Market Conditions?
Effectiveness depends heavily on context.
Let us explain:
1. Strong Trending Markets
This is where Elliott Wave shines.
Example: Suppose a stock breaks into a new uptrend. It forms a clear Wave 1 impulse. It pulls back in a three-wave Wave 2 correction near 50 percent retracement.
That is often where professional traders enter.
Wave 3 typically shows:
- Strong volume
- Momentum breakout
- Broad market participation
In such conditions, how effective is Elliott wave theory? Quite effective, especially for swing trading.
2. Sideways Or News Driven Markets
Here it becomes tricky.
During election weeks, policy announcements, or global shocks, patterns distort. Waves overlap. Extensions fail. False breakouts increase.
In these phases, wave counts change frequently. Traders who rigidly stick to one count often get trapped.
Honestly, this is where beginners lose faith.
3. Triangle Structures, Thrust Targets, And Timeframe Reliability
Triangles often show up during slow or corrective market phases. But structure and context matter. Here is how traders evaluate them:
- Internal Structure Rules
- The triangle must have five legs labeled A B C D E
- Each leg must form a 3-wave corrective move
- No leg should unfold as a clear 5-wave impulse
- If a five-wave structure appears inside a leg, the count is likely incorrect
A clean internal structure increases confidence.
4. Thrust Measurement Formula
Thrust Target = Breakout Level ± Widest Triangle Range
- For a bullish breakout: Target = Breakout Price + Base Range
- For a bearish breakout: Target = Breakout Price − Base Range
5. Timeframe Reliability
- Daily and Weekly triangles are more reliable
- 1-minute and very low timeframe triangles often reflect market noise
- Higher timeframes show broader participation and stronger follow-through
How Reliable Is The Elliot Wave Analysis In Forecasting The Markets?
Forecasting sounds bold. Maybe too bold.
Elliott Wave does not forecast exact prices. It maps probable paths. Think of it like a weather model.
It shows likely scenarios, not guaranteed outcomes.
A disciplined wave trader usually prepares alternate counts:
- Primary count
- Alternate count
- Invalidation level
For example:
If Wave 4 overlaps Wave 1 in an impulse, the count is invalid. That invalidation gives a clear exit point.
So, how reliable is the Elliot wave analysis in forecasting the markets? Reliable when treated as a probability model.
When you align your primary count with Fibonacci targets, your Elliott Wave forecast becomes a strategic map rather than a mere prophecy.
Why Some Traders Swear By It and Others Quit?
Here’s the contradiction.
Some professionals build entire careers around Elliott Wave. Others abandon it within months.
Why?
Because it demands:
- Patience
- Flexibility
- Deep practice
- Emotional discipline
New traders want speed. Elliott Wave rewards structure.
It also forces you to accept being wrong quickly. If your wave count breaks the rule structure, you must adjust. No ego allowed.
Elliott Wave Analysis Example
NIFTY forms a five-wave advance on the daily chart.
Wave 1 forms.
Wave 2 retraces 50 percent.
Wave 3 extends strongly.
Wave 4 is shallow and sideways.
Wave 5 shows momentum divergence.
An experienced trader who knows how to identify a market correction may:
- Book profits near the Fibonacci 1.618 extension
- Watch for an ABC correction
- Re-enter after Wave C completes
Notice the rhythm? Enter corrections. Exit near exhaustion.
That is how traders actually apply it.
Conclusion
So does Elliott wave theory work?
Yes, when:
- You combine it with risk management
- You avoid forcing counts
- You respect invalidation levels
- You use it alongside other tools
No, when:
- You try to predict every tick
- You ignore the broader market context
- You refuse to adapt
Markets breathe. Waves reflect that breath. But breath changes pace.
If you treat Elliott Wave as a flexible map rather than a rigid script, it becomes powerful. If you treat it as destiny, it becomes frustrating.
And honestly, that difference changes everything.
Still wondering, does Elliott Wave Theory work?
If you want to move beyond the theory and master the execution, a structured Elliott Wave mentorship can help you navigate these complex patterns with precision.
Join our stock market classes and learn how to apply it confidently in real trading conditions.
FAQs
Q1: Does Elliot Wave Work for Intraday Trading?
Ans: It can, but lower timeframes produce more noise. Many traders prefer using it on 4-hour or daily charts for a clearer structure.
However, if you have the discipline to filter out that noise, you can effectively use Elliott Wave for intraday trading by focusing on high-momentum Wave 3 setups on the 5-minute or 15-minute charts.
Q2: What Is The Success Rate Of The Elliott Wave?
Ans: There is no fixed percentage. Success depends on experience, confirmation tools, and disciplined risk management.
Q3: How Reliable Is The Elliot Wave Analysis In Forecasting The Markets?
Ans: It is reliable as a probability framework with defined invalidation levels, not as a guaranteed prediction tool.
Before investing capital, invest your time in learning Stock Market.
Fill in the basic details below and a callback will be arranged for more information:


