


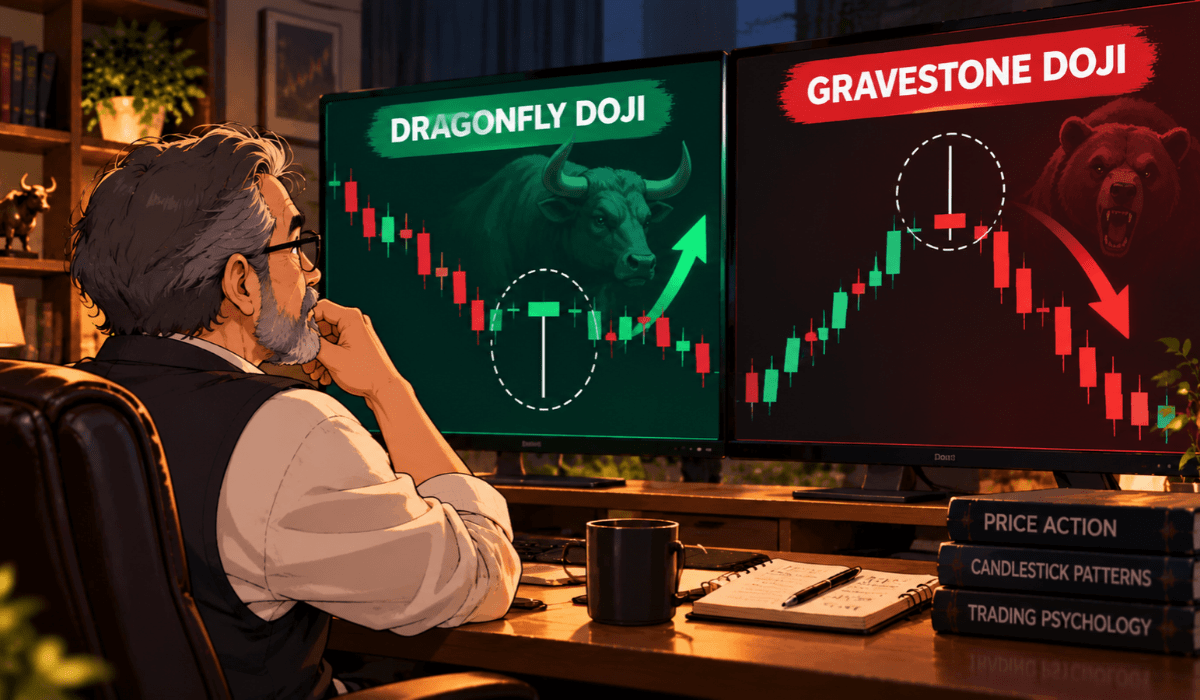
Dragonfly doji vs gravestone doji is a question almost every chart beginner asks. Both candles have a tiny body, yet they point in opposite directions.
First, this page shows how each one looks, where the open and close sit, and when each pattern deserves your attention.
Dragonfly Doji vs Gravestone Doji: Key Differences at a Glance
Here is a quick side-by-side view before we go deeper. So, read it once, then use the sections below to see why each row is true.
| Feature | Dragonfly doji | Gravestone doji |
|---|---|---|
| Shape | Looks like a “T” | Looks like an upside-down “T” |
| Long shadow | Lower shadow | Upper shadow |
| Open and close | Both near the day’s high | Both near the day’s low |
| Upper shadow | Almost none | Long |
| What price did | Fell, then recovered fully | Rose, then fell back fully |
| Usual reading | Possible bullish reversal | Possible bearish reversal |
| Works best | After a fall or near support | After a rise or near resistance |
The last two rows are the important ones. However, a shape alone is never the signal, the location is.
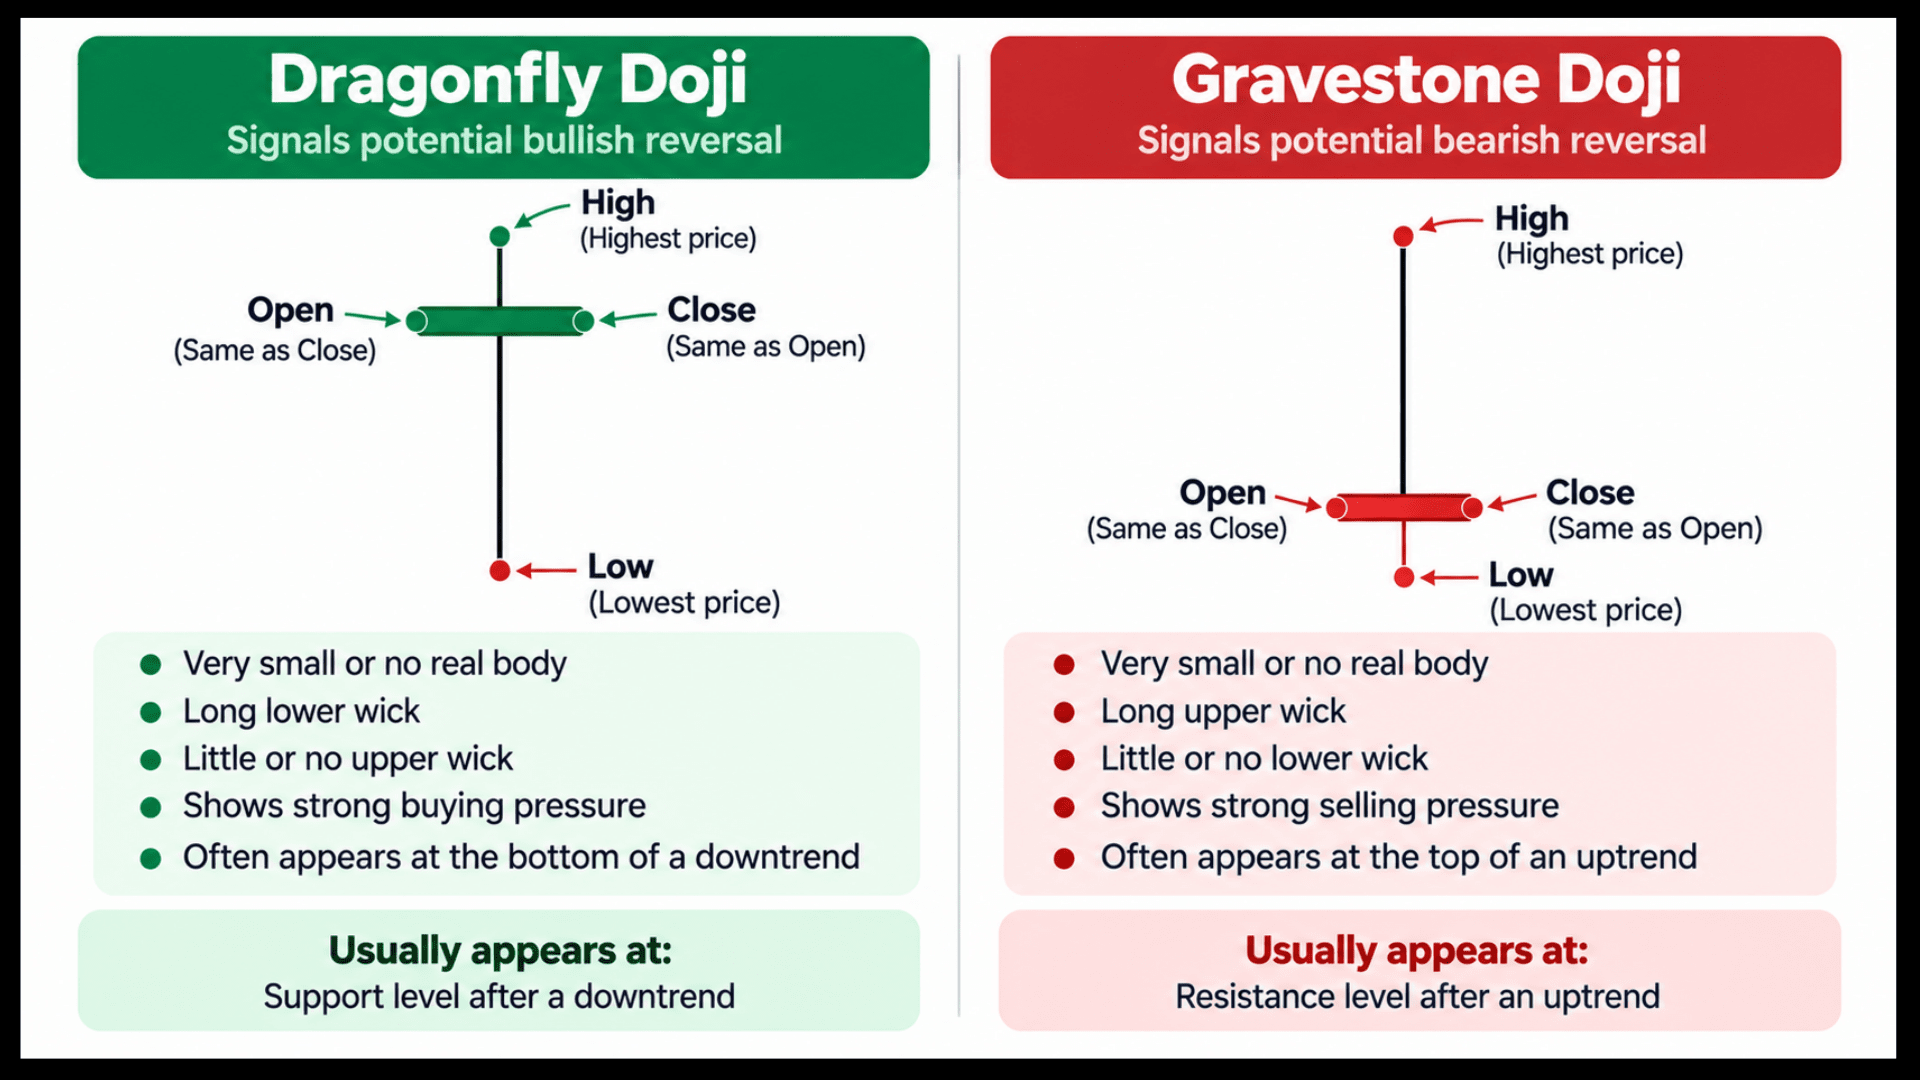
Also, think of the table as a memory aid. The long shadow always points to the side that lost the fight.
What Is a Doji Candle? Why Dragonfly and Gravestone Are Called Doji
Both of these shapes belong to one family of candles. So, knowing that family makes each pattern easier to read.
Both patterns are special cases of the doji candlestick, where the open and close are almost the same price. For the basics first, what does a doji candle indicate covers them clearly.
That tiny body shows a tug of war that ended without a clear winner. Also, the long shadow shows which side tried hardest, and failed.
Because of this, a doji is a pause in the story, not the end of it. In fact, what happens next decides the meaning.
Dragonfly Doji: Meaning, Shape and Bullish Reading
A dragonfly doji is often read as a sign that sellers are losing their grip. Let us see why.
A dragonfly doji has a long lower shadow and almost no upper shadow. The open, high and close sit close together at the top.
First, sellers pushed price far down during the session. Then buyers pulled it all the way back up before the close.
That recovery shows buyers defending a lower price.
A longer lower shadow means a deeper push down and a stronger recovery, which makes the candle more noticeable. So, when it appears after a decline, it hints that selling pressure may be fading.
You can think about the psychology behind candlestick patterns like this: the early sellers got trapped, and fear turned into relief by the close.
Gravestone Doji: Meaning, Shape and Bearish Reading
A gravestone doji is the mirror image of the dragonfly. Now let us see what it says about the buyers.
A gravestone doji has a long upper shadow and almost no lower shadow.
The open, low and close sit together at the bottom of the candle. Also, the name comes from the shape of a tombstone.
Buyers pushed price up, but sellers took control and dragged it back to the open. That shows buyers failing to hold higher prices.
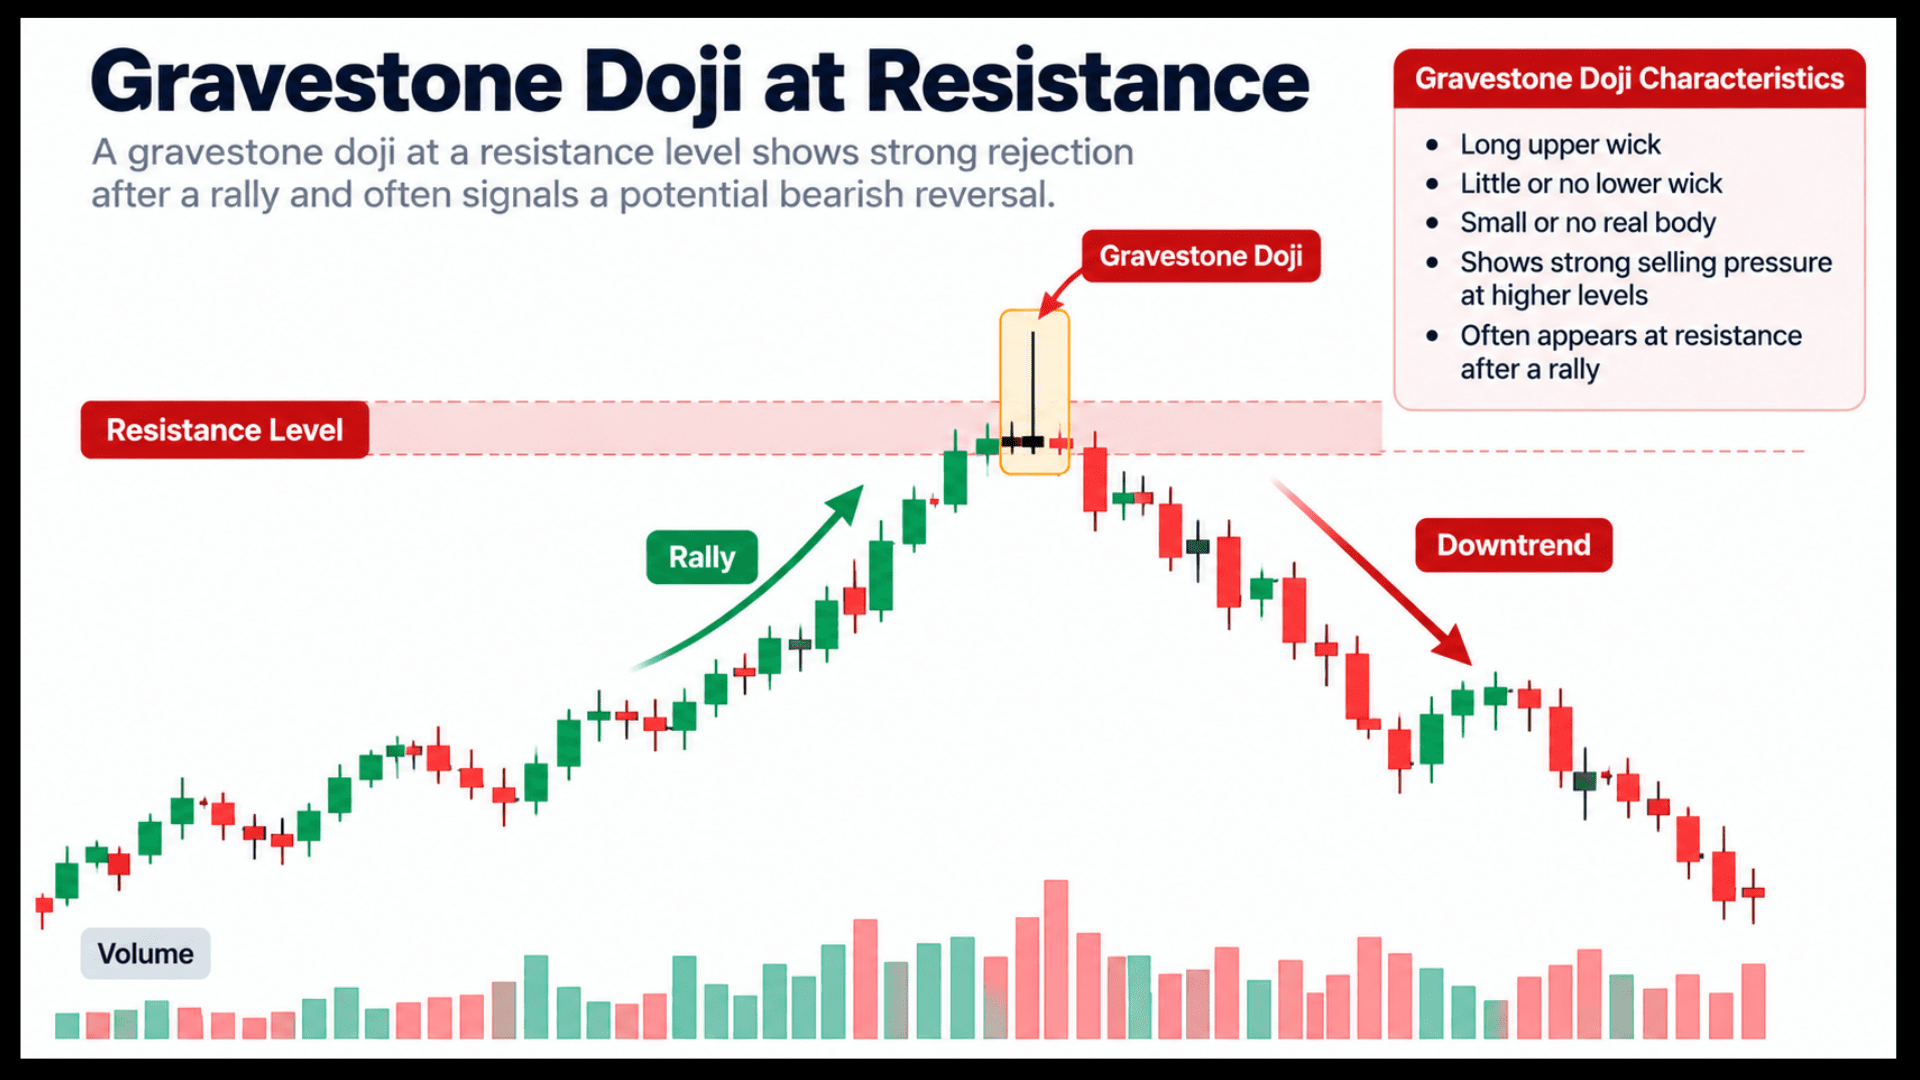
After a rise, it hints that the rally may be losing strength. Also, the longer the upper shadow compared to recent candles, the stronger the rejection looks.
Many beginners feel pressure to buy because price looked strong. However, this candle shows that strength disappearing.
Dragonfly Doji vs Gravestone Doji Example With Numbers
Numbers make the difference easier to see. So, the two candles below are made-up values for illustration only, using Company A as a placeholder.
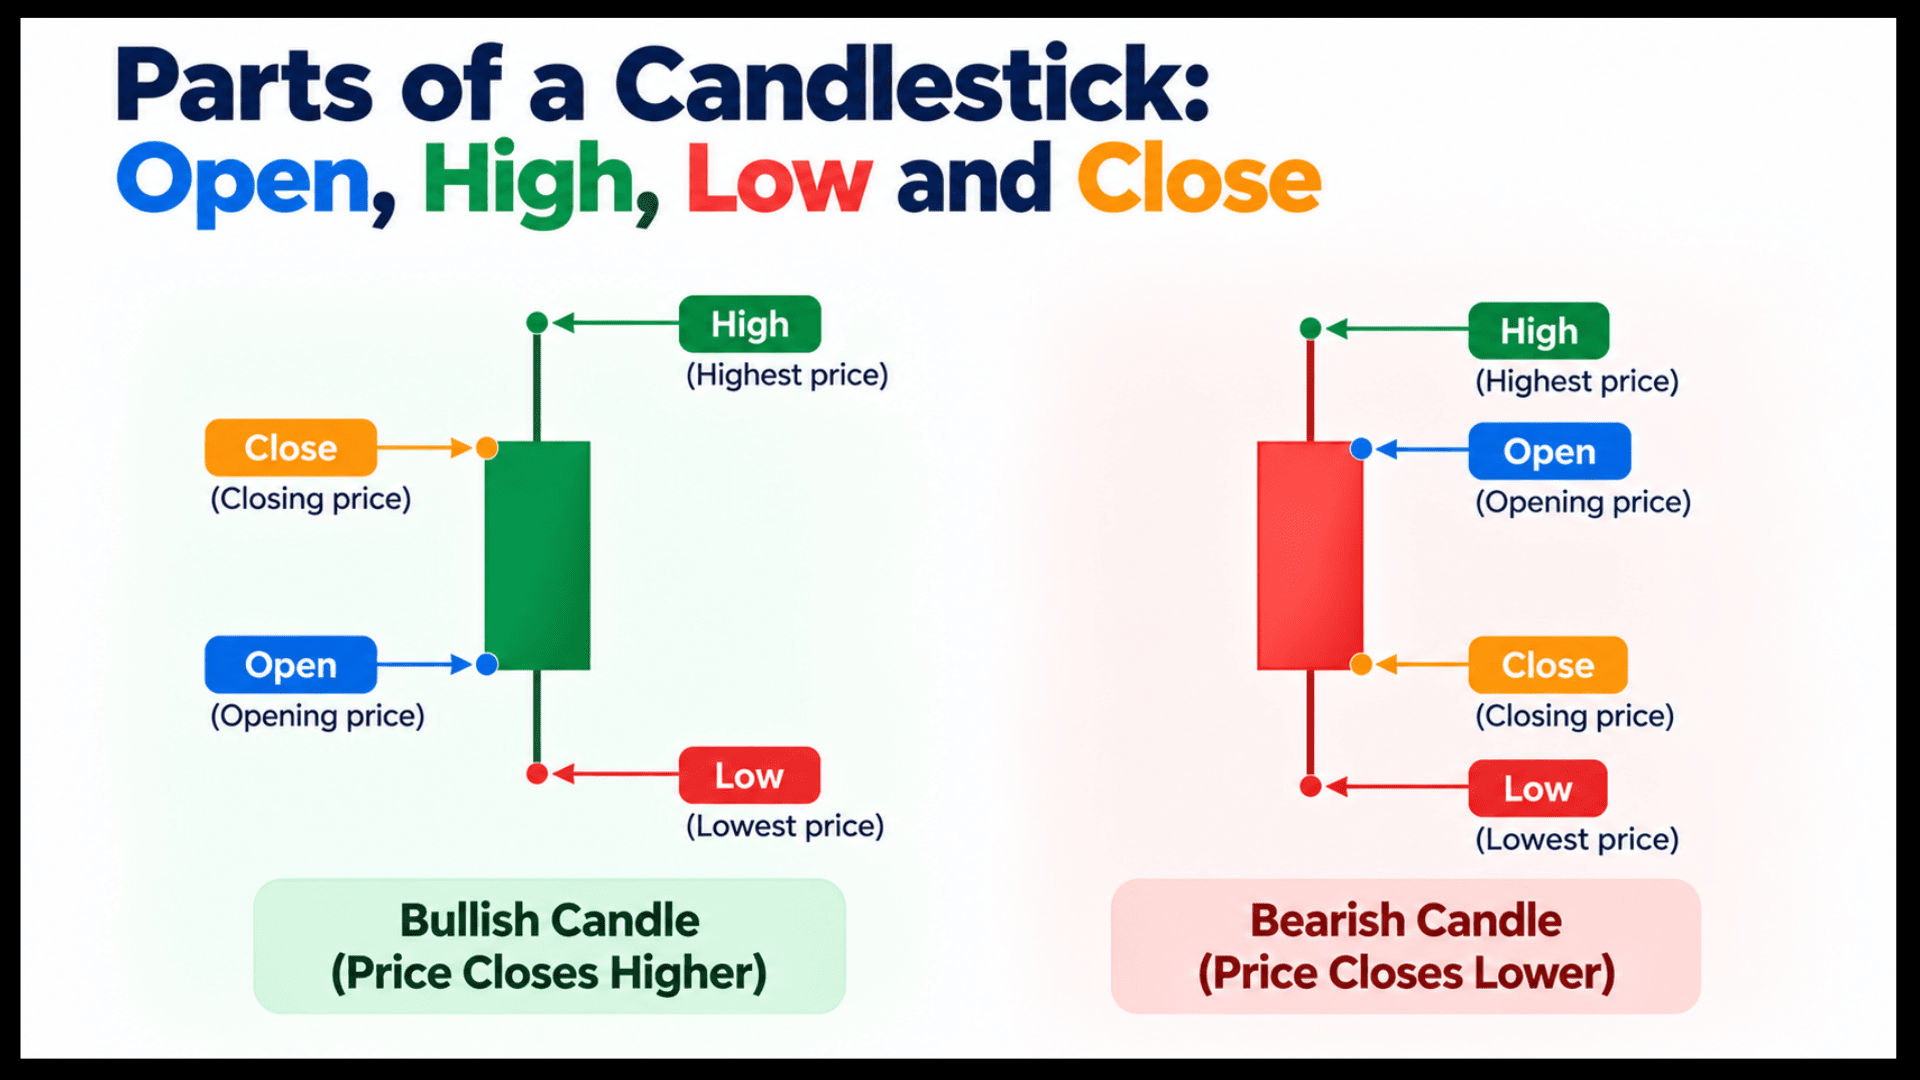
The formula used is: range = high minus low, body = absolute value of (close minus open), and each part is shown as a percentage of the range.
| Part of candle | Dragonfly doji | Gravestone doji |
|---|---|---|
| Open | 100.0 | 100.0 |
| High | 100.2 | 104.0 |
| Low | 96.0 | 99.9 |
| Close | 100.1 | 100.0 |
| Range | 4.2 | 4.1 |
| Body (% of range) | 2.4% | 0.0% |
| Upper shadow (% of range) | 2.4% | 97.6% |
| Lower shadow (% of range) | 95.2% | 2.4% |
In the dragonfly, about 95% of the range is lower shadow. Likewise, in the gravestone, about 98% of the range is upper shadow.
Notice that neither candle needs a perfect zero body. In fact, a body of a few percent of the range is usually still treated as a doji.
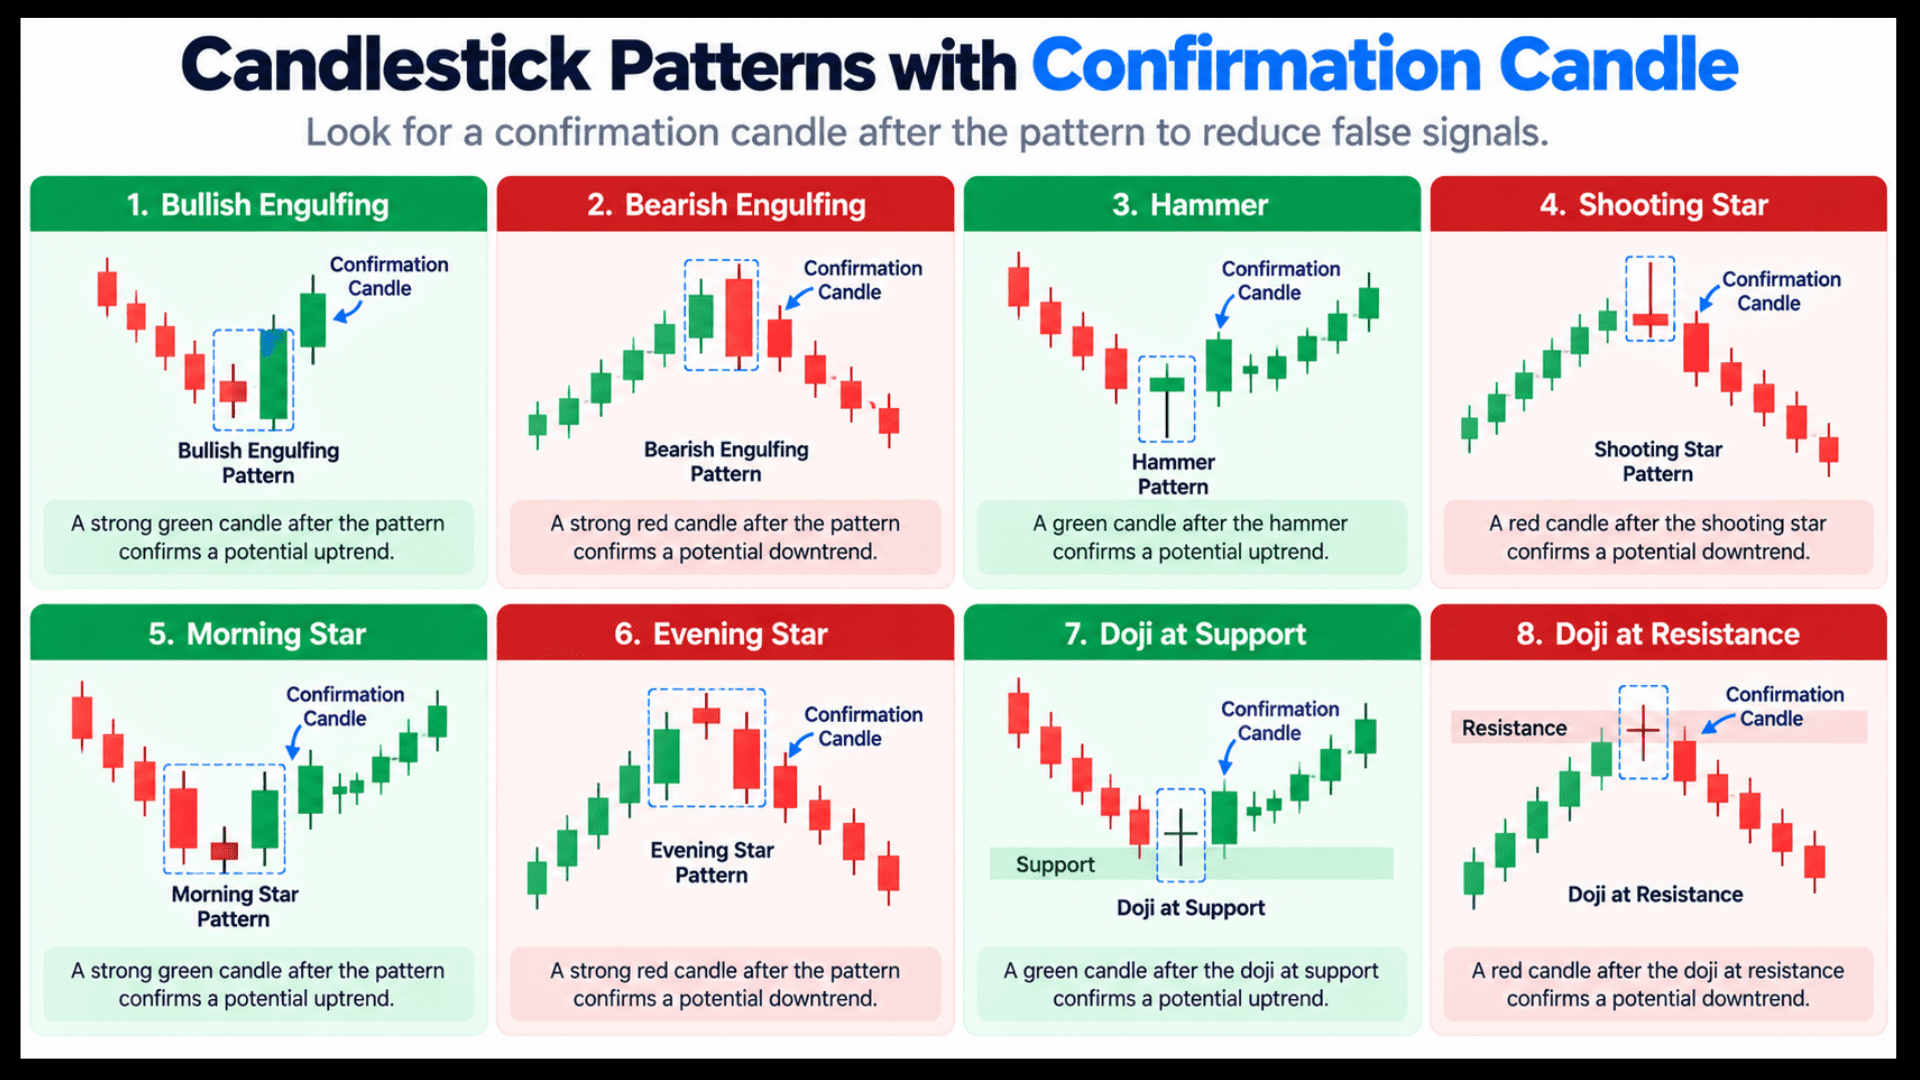
However, if the body grows larger with both shadows long, you may be looking at a different candle. So, compare doji vs spinning top before labelling it.
How to Confirm a Dragonfly or Gravestone Doji Before You Trade
A single candle is just one day of opinion. Still, a few simple checks turn it into something more useful.
Most traders have acted on a good-looking candle and regretted it later. So, these three checks are worth the extra minute.
| Check | Dragonfly doji | Gravestone doji |
|---|---|---|
| Trend before it | Needs a clear fall | Needs a clear rise |
| Level | Near support | Near resistance |
| Next candle | Closes above the doji’s high | Closes below the doji’s low |
Trend first. A dragonfly in the middle of a sideways market means very little. The same goes for a gravestone with no rally before it.
Support and resistance next. A dragonfly at a level where price bounced earlier carries more weight. Similarly, a gravestone at a level where price stalled earlier does the same.
Volume and range help. A doji on a day with unusually large range or busy trading tells you more than one on a quiet day.
Confirmation last. The next candle should move in the direction the doji hints at. Otherwise, the doji is only a question, not an answer.
If you want to understand how these ideas fit together, learn how to read candlestick pattern as a group of clues, never as a single trigger.
Dragonfly and Gravestone Doji False Signals: Why They Fail
No candle pattern works every time. In fact, knowing when a doji fails protects you more than knowing when it works.
Here are the most common ways these two patterns mislead:
- Wrong location. A dragonfly in a downtrend that keeps falling is just a pause.
- No confirmation. The next candle goes the other way and the signal dies.
- Tiny candles. On a very small range, noise looks like a pattern.
- Thin or gapping markets. Sudden news can create shapes that mean nothing.
- Different time frames. A signal on a 5-minute chart can disappear on the daily chart.
A doji also does not tell you when to enter or where to place a stop. That is a separate skill, covered in our notes on how to trade doji candlestick pattern.
Common Doji Candle Mistakes Beginners Make
Most losses around doji candles come from habits, not from the pattern itself. So, these mistakes show up again and again.
- Calling every long-shadow candle a dragonfly or gravestone.
- Trading the pattern in the middle of a range.
- Ignoring the size of the candle compared to recent candles.
- Acting on the doji candle itself without waiting for confirmation.
- Treating “bullish” and “bearish” labels as promises.
A good candlestick pattern book can help you recognise shapes, but it cannot replace screen time and review.
How to Practise Reading Doji Candles on Real Charts
Reading about candles is easy. However, seeing them on real charts is where the lesson sticks.
Open a daily chart of any index and scroll back through a year of candles. Then mark every dragonfly and gravestone you can find.
For each one, write down the trend before it, the nearby level, and what the next candle did. After twenty marks, you will see how often context mattered.
This is how you learn candlestick patterns the slow way, and it builds real judgement.
Also, keep a small notebook with a screenshot and one line on why you chose each candle.
A mentor reviewing your marked charts can point out what you missed. As a result, that feedback is far faster than learning alone.
Do you also want to read dragonfly and gravestone dojis on live charts, with someone checking your work? In our live classes, you can join from your mobile, ask your doubts, and learn step by step.
Watching videos alone rarely builds chart sense. Instead, real charts, personalised mentorship and honest feedback make the real difference.
Conclusion
The dragonfly doji shows buyers recovering from a fall. In contrast, the gravestone doji shows sellers rejecting a rise.
Still, neither is a promise. Trend, level, and a confirming candle decide whether the signal is worth acting on.
So, practise on past charts first, keep your risk small, and never trade money you cannot afford to lose.
Disclaimer: This page is for education only and is not investment advice or a recommendation to buy or sell. All numbers are hypothetical and shown for illustration only. Trading involves risk of loss.
Frequently Asked Questions
Before investing capital, invest your time in learning Stock Market.
Fill in the basic details below and a callback will be arranged for more information: