

Let’s be honest: the stock market can feel like a wild rollercoaster. You see prices shooting up, dipping down, and sometimes, you just want to scream.
That’s where Elliott Wave theory comes in, giving structure to all that chaos.
Today, we’re focusing on Elliott wave 4 rules, the often misunderstood “pause” in a market rally.
And to make things real, we’ll use this NIFTY 50 chart as our guide.
What Are The Elliott Wave 4 Rules?
Wave 4 is the market’s breather.
After the explosive momentum seen in wave 3 of Elliott wave cycle, the price usually slows down, moves sideways, or pulls back slightly to regain strength before Wave 5 begins.
This pause follows specific Elliott Wave 4 Rules, and one rule is especially important.
Wave 4 in Elliott Wave appears after the strong momentum of Wave 3.
It represents a pause or consolidation before the market attempts its final push in Wave 5.
Understanding the rules of Wave 4 helps traders avoid miscounting waves and identify potential entry zones for the next trend move.
Let’s break down the key rules that define Wave 4:
Rule 1: Wave 4 Must Not Overlap Wave 1
This is one of the most important rules in an impulse wave pattern.
In a standard impulse pattern, Wave 4 cannot enter the price territory of Wave 1.
For example:
- If Wave 1 ended at 10,000 in an uptrend,
- Wave 4 must stay above that level.
If Wave 4 overlaps Wave 1, the structure is no longer a valid impulse wave.
It may instead be:
- A diagonal pattern, or
- A different corrective structure.
This rule helps traders quickly invalidate incorrect wave counts when analyzing markets like the NIFTY 50 or NIFTY Bank.
Rule 2: Wave 4 Is Usually a Sideways Correction
Unlike Wave 2, which is often sharp and deep, Wave 4 tends to be slow and sideways.
Common Wave 4 structures include:
- Flat corrections
- Elliott Wave Triangle Pattern
- Complex sideways consolidations
The reason is simple: after the strong momentum of Wave 3, the market often pauses to digest gains rather than sharply reversing.
This phase highlights the core difference between Impulsive & Corrective Wave behavior, as the market moves from a high-speed trend into a stalled, defensive posture.
This sideways movement often frustrates traders because the market appears directionless for a period of time.
Rule 3: Alternation With Wave 2
One of the key guidelines in Elliott Wave analysis is the principle of alternation.
This rule suggests that Wave 2 and Wave 4 usually look different from each other.
Examples:
| Wave 2 | Wave 4 |
| Sharp correction | Sideways correction |
| Zigzag pattern | Flat or triangle |
| Deep retracement | Shallow retracement |
So if Wave 2 was a quick and deep drop, Wave 4 will likely be slower and more sideways.
Alternation helps traders avoid expecting the same correction pattern twice in the same impulse structure.
Rule 4: Wave 4 Retracement Levels
Wave 4 normally retraces a portion of Wave 3. Traders often combine Elliott Wave with Fibonacci to estimate potential support zones.
Common retracement levels include:
| Wave | Typical Fibonacci Level |
| Wave 4 | 23.6% – 38.2% of Wave 3 |
Wave 4 usually retraces less than Wave 2, because Wave 3 is often the strongest move in the trend.
If Wave 4 retraces more than 50% of Wave 3, it may indicate:
- Weak momentum
- Possible miscount of waves
- A larger correction is forming
Rule 5: Wave 4 Often Respects Channel Boundaries
Many traders draw trend channels to estimate where Wave 4 might end. This helps you identify the reversal zone before the final push begins.
Once the bounce from the channel is confirmed, your next task is to calculate the potential Elliott wave 5 length to set your ultimate profit targets.
A common technique is:
- Draw a trendline connecting Wave 1 and Wave 3.
- Draw a parallel line through Wave 2.
Wave 4 often finds support near the lower boundary of this channel in an uptrend.
This helps traders identify potential reversal zones before Wave 5 begins.
Charting platforms like TradingView make it easy to draw these channels and combine them with Fibonacci levels.
Examples of Elliott Wave 4
Let’s understand these rules with examples
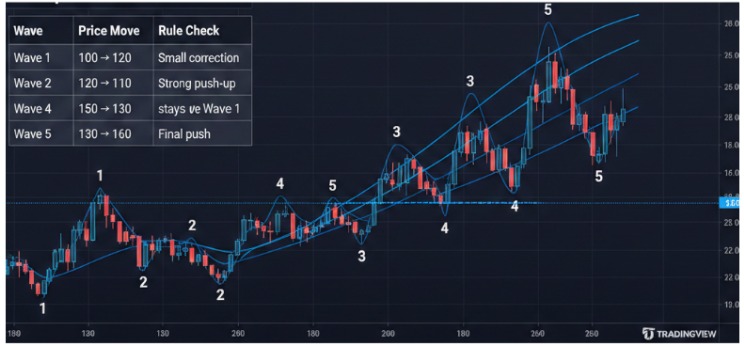
Here’s how the numbers break down on this chart:
| Wave | Price Move | Rule Check |
| Wave 1 | 100 → 120 | Initial impulse |
| Wave 2 | 120 → 110 | Small correction |
| Wave 3 | 110 → 150 | Strong push-up |
| Wave 4 | 150 → 130 | Corrective, stays above Wave 1 |
| Wave 5 | 130 → 160 | Final push |
It can be noticed that the low of Wave 4 (130) remains higher than the end of Wave 1 (120).
This preserves the impulse. Assuming that Wave 4 dropped below 120, the pattern would be null, and we may be forced to reconsider the count of waves.
The market is sort of a conversation. Wave 3 shouts, Wave 4 whispers, Wave 5 finishes.
Spotting Wave 4 on The NIFTY 50 Chart
Take a look at the chart below. The waves are clearly labeled to show how these rules work in real-time.
Learning how to spot Wave Patterns like this allows you to anticipate the next move rather than reacting to it.
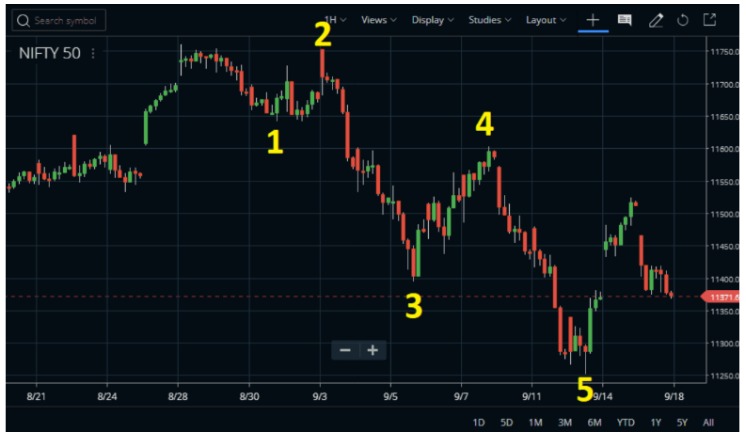
- Wave 1 starts the upward movement.
- Wave 2 dips slightly as the market takes a breather.
- Wave 3 is the big move up. And see how intense and long it is.
- Wave 4 withdraws behind Wave 3, and more importantly, it then does not penetrate into Wave 1.
Here is the point: Wave 4 of this chart concludes safely higher than Wave 1. That is book compliance on the Elliott wave 4 rules.
- The cycle is then repeated with Wave 5 pushing up the prices to the new high.
This mere visual can help one understand why Wave 4 is more of a pause than a reversal, making it a vital part of any Elliott Wave forecast.
Why Wave 4 Rules Matter?
You might be wondering, “Why all this fuss over one wave?”
Well, here’s the deal:
- Wave 4 gives traders a sense of whether the trend is real.
- It helps avoid false signals. If Wave 4 dips into Wave 1 territory, that’s a red flag: the market could be forming a different structure.
- By sticking to the rules, you maintain a reliable method to forecast potential price moves.
So yes, it’s technical, but it’s also about psychology, the market’s way of showing confidence without chaos.
Conclusion
Here’s a mental trick: imagine the market as a spring. Wave 1 sets the tension, Wave 3 stretches it high, and Wave 4 relaxes it slightly.
But if Wave 4 compresses too far, the spring loses energy. Traders watching the NIFTY 50 chart, given above, can see this perfectly.
Wave 4 is the controlled pullback, setting up a clean Wave 5.
FAQs
Q1: Can Wave 4 overlap Wave 1?
Ans: No, in a standard impulse, overlapping Wave 1 invalidates the count. If an overlap occurs, you might be looking at an Elliott wave leading diagonal, which is a special motive pattern where overlap is required.
Q2: Does Wave 4 always move sideways?
Ans: Not always. It can be a flat, zigzag, or triangle, but the key is that it shouldn’t enter Wave 1’s range.
Q3: How deep should Wave 4 retrace?
Ans: Commonly, 23% to 50% of Wave 3, enough to breathe but not to erase momentum.
Master the Elliott Wave 4 Rules with real market examples. If you want to trade like a pro, join our classes in stock market for deeper, practical training.
Before investing capital, invest your time in learning Stock Market.
Fill in the basic details below and a callback will be arranged for more information:


