

If you closely observe a market move, you will find that Markets rise in five waves, then they correct.
That rhythm repeats again and again. If you trade actively, you’ve felt it, the pullback that tests your conviction after a strong rally.
That pullback often follows a structure. And that structure is defined by the correction pattern.
However, to use it properly, there are Elliott Wave ABC correction rules that you must consider before applying it to your charts.
Let’s break it down clearly and practically.
Elliott Wave ABC Correction Pattern
The Elliott wave abc correction is a three-wave structure that appears after a completed five-wave impulse.
It can take three common forms:
- Zigzag
- Flat
- Triangle
Each follows the core A B C sequence but behaves differently in depth and shape.
For instance, an Elliott wave triangle pattern consists of five overlapping waves labeled A B C D E and reflects market indecision before the final move of a larger pattern.
1. Zigzag Correction
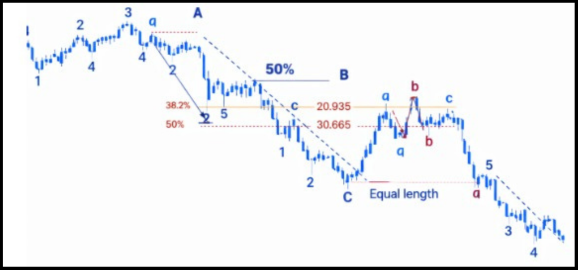
This is sharp and aggressive. It typically follows a 5 3 5 internal structure.
- Wave A forms five sub-waves.
- Wave B forms three.
- Wave C forms five again.
Wave B usually retraces 38 percent to 61 percent of Wave A. Wave C often equals Wave A in length.
Zigzags feel fast. They often occur in strong trends.
2. Flat Correction
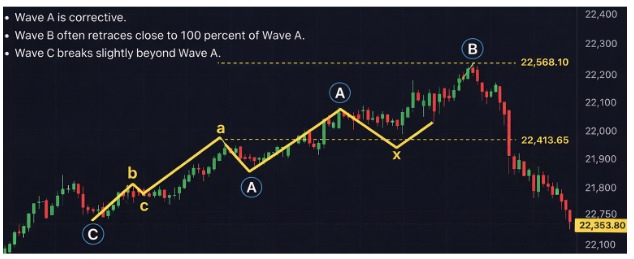
Flats are more sideways. The structure is 3 3 5.
- Wave A is corrective.
- Wave B often retraces close to 100 percent of Wave A.
- Wave C breaks slightly beyond Wave A.
Understanding the nuances of an Elliott wave flat correction is vital because they trap traders.
Price appears stable, then suddenly breaks.
3. Triangle Correction
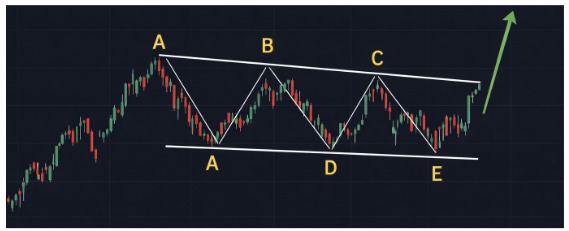
Triangles consist of five overlapping waves labeled A B C D E. They appear before the final move of a larger pattern.
They reflect indecision. Volume contracts. Range tightens.
Elliott Wave ABC Correction Rules Explained
In Elliott Wave Theory, markets do not move in a straight line. A trending move usually happens in five waves, followed by a three-wave corrective phase labeled A–B–C.
Understanding these correction rules helps traders decide whether a price pullback is just a temporary pause in the trend or the start of a larger reversal.
Let’s break down the most important rules traders use when analyzing an ABC correction.
1. Corrections Move Against The Main Trend
The most basic rule is that a correction always moves opposite to the dominant trend.
- If the larger trend is bullish, the ABC correction will move downward.
- If the larger trend is bearish, the ABC correction will move upward.
This highlights the fundamental difference in impulsive versus corrective wave price action.
For example, in a bullish cycle:
- Wave 1–5: The main trend moves upward.
- Wave A: Price starts falling as the correction begins.
- Wave B: A temporary bounce upward.
- Wave C: The final leg downward completes the correction.
The purpose of this phase is to correct the previous impulsive move, often shaking out weak hands before the next trend continuation.
Traders watching indices like NIFTY 50 or NIFTY Bank often see these pullbacks after a strong rally.
2. Wave C cannot be the Shortest
In most corrective structures, especially zigzag corrections, Wave C behaves like a small Impulse wave pattern.
Because of this:
- Wave C should usually be equal to or longer than Wave A.
- It should not be the shortest wave when compared with A and B.
Typical scenarios include:
- Wave C ≈ Wave A (common equality pattern)
- Wave C = 1.618 × Wave A (extended move)
If Wave C ends up being unusually small compared to both A and B, it often signals that:
- The wave count may be incorrect, or
- The structure may be a different type of correction.
This rule helps traders avoid mislabeling market structure.
3. Internal Structure Must Follow Specific Patterns
Corrective waves are not random. They follow specific internal wave structures.
Two common patterns appear in ABC corrections:
5–3–5 Structure (Zigzag Correction)
This is the most common correction pattern.
Structure:
- Wave A: 5 internal waves
- Wave B: 3 internal waves
- Wave C: 5 internal waves
This pattern usually appears when the market corrects sharply and quickly.
Example behavior:
- Strong drop (Wave A)
- Weak bounce (Wave B)
- Another strong drop (Wave C)
3–3–5 Structure (Flat Correction)
Flat corrections behave differently.
Structure:
- Wave A: 3 waves
- Wave B: 3 waves
- Wave C: 5 waves
Flat corrections often occur in sideways markets where price moves in a range rather than trending strongly.
If the internal wave count does not match these structures, the wave labeling may need to be reconsidered.
4. Fibonacci Relationships Matter
A major component of Fibonacci Retracement in Elliott Wave analysis is measuring how far corrective waves travel relative to earlier waves.
While analyzing these, traders must also respect the Elliott wave 4 rules, which dictate that in a standard impulse, the fourth wave must not overlap the first.
Certain Fibonacci ratios appear repeatedly in market corrections.
| Wave | Typical Fibonacci Level |
| Wave B | 38% – 61% retracement of Wave A |
| Wave C | 100% or 161.8% of Wave A |
Interestingly, just as you measure Elliott wave 5 length to find the end of a trend, measuring Wave C helps you identify the exact exhaustion point of a correction.
Both follow similar Fibonacci projection logic to help traders find high-probability reversal zones.
Wave B
Wave B usually retraces a portion of Wave A.
Common retracement zones:
- 38.2% – shallow correction
- 50% – balanced retracement
- 61.8% – deeper retracement
Wave C
Wave C often mirrors Wave A.
Common projections:
- 100% of Wave A (equal length)
- 161.8% extension (stronger correction)
These Fibonacci relationships appear consistently across markets, from equities to crypto.
Traders frequently apply these tools on platforms like TradingView when analyzing assets such as Bitcoin or Indian market indices.
Why ABC Correction Rules Matter for Traders?
Recognizing a valid ABC correction helps traders:
- Identify buy-the-dip opportunities in uptrends
- Avoid entering trades too early during corrections
- Estimate where a trend might resume
Instead of guessing market direction, Elliott Wave rules provide a structured way to interpret price behavior.
Example Of Elliott Wave ABC Correction
Let’s make this practical.
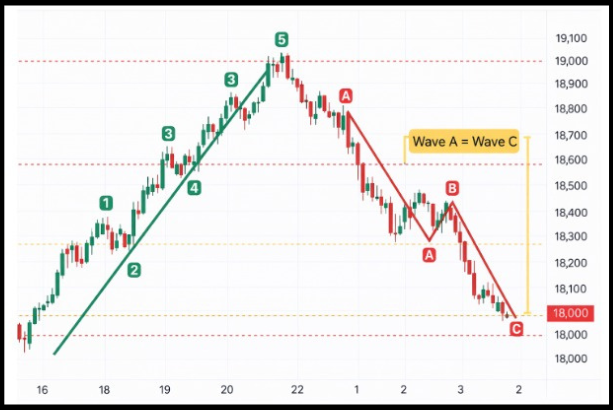
Suppose NIFTY rallies from 18000 to 19000 in five waves.
Now the correction begins.
- Wave A falls from 19000 to 18500.
- Wave B retraces back to 18800.
- Wave C drops to 18000.
Wave C equals Wave A in length. Structure aligns with a Zigzag.
The correction ends near prior support. Momentum divergence appears. Volume dries up.
That’s textbook.
But here’s the twist. Corrections often feel worse than they actually are. Traders panic at Wave C, assuming trend reversal. In reality, it’s often just a pause.
Common Mistakes Traders Make While Analyzing ABC Correction Waves
Even experienced traders misread corrections.
- Confusing a correction for a trend reversal
- Ignoring Fibonacci levels
- Forcing wave counts to fit bias
- Entering during Wave B, assuming continuation
You know what?
Wave B is the trickiest. It creates false hope. Price retraces strongly, making traders think the correction is over. Then Wave C hits.
Conclusion
The Elliott Wave ABC correction rules are not just theory. They are practical filters that help you judge whether a pullback is healthy or dangerous.
Here is what we reinforced:
- Corrections move against the main trend, not with it.
- The structure must follow clear internal logic, like 5 3 5 for Zigzag or 3 3 5 for Flat.
- Wave C should show strength and is often equal to or longer than Wave A.
- Fibonacci levels repeatedly guide Wave B and Wave C behavior.
- After completion, the larger trend usually resumes, but only after confirmation.
Five waves build momentum. Three waves reset it. That rhythm forms the backbone of market structure.
When you apply these rules patiently, corrections stop feeling random. They start feeling measurable.
Confused about Elliott Wave ABC Correction Rules?
Master the art of wave counting and stop guessing market turns.
Join our stock market classes today to learn how to identify high-probability trade setups with professional, step-by-step guidance!
FAQs
Q1: Is Elliott Wave Abc Correction Always Three Waves?
Ans: Yes. The correction consists of A, B, and C waves, though internal structures differ, like Zigzag, Flat, or Triangle.
Q2: How Do I Confirm The End of an ABC Correction?
Ans: Look for completion near Fibonacci levels, momentum shift, and break of Wave B in trend direction.
Q3: What Happens After Elliott Wave ABC Correction?
Ans: Usually, the larger trend resumes with a new impulse wave, provided structure confirms continuation.
Before investing capital, invest your time in learning Stock Market.
Fill in the basic details below and a callback will be arranged for more information:


