
Why do some traders always seem to know where the market is heading next? The answer often comes down to Elliott wave calculations.
Price charts can look clustered and overwhelming at first sight. But experienced traders do not see chaos. They see a rhythm beneath the noise, a pattern that repeats itself across every market and every timeframe.
Elliott wave with Fibonacci calculations, use these repeating wave patterns combined with specific mathematical ratios to predict the direction of the next move.
The logic is more practical than it sounds. Markets rise, pause, fall, and rise again.
When you measure these movements carefully, your trading decisions stop being emotional and start being structured.
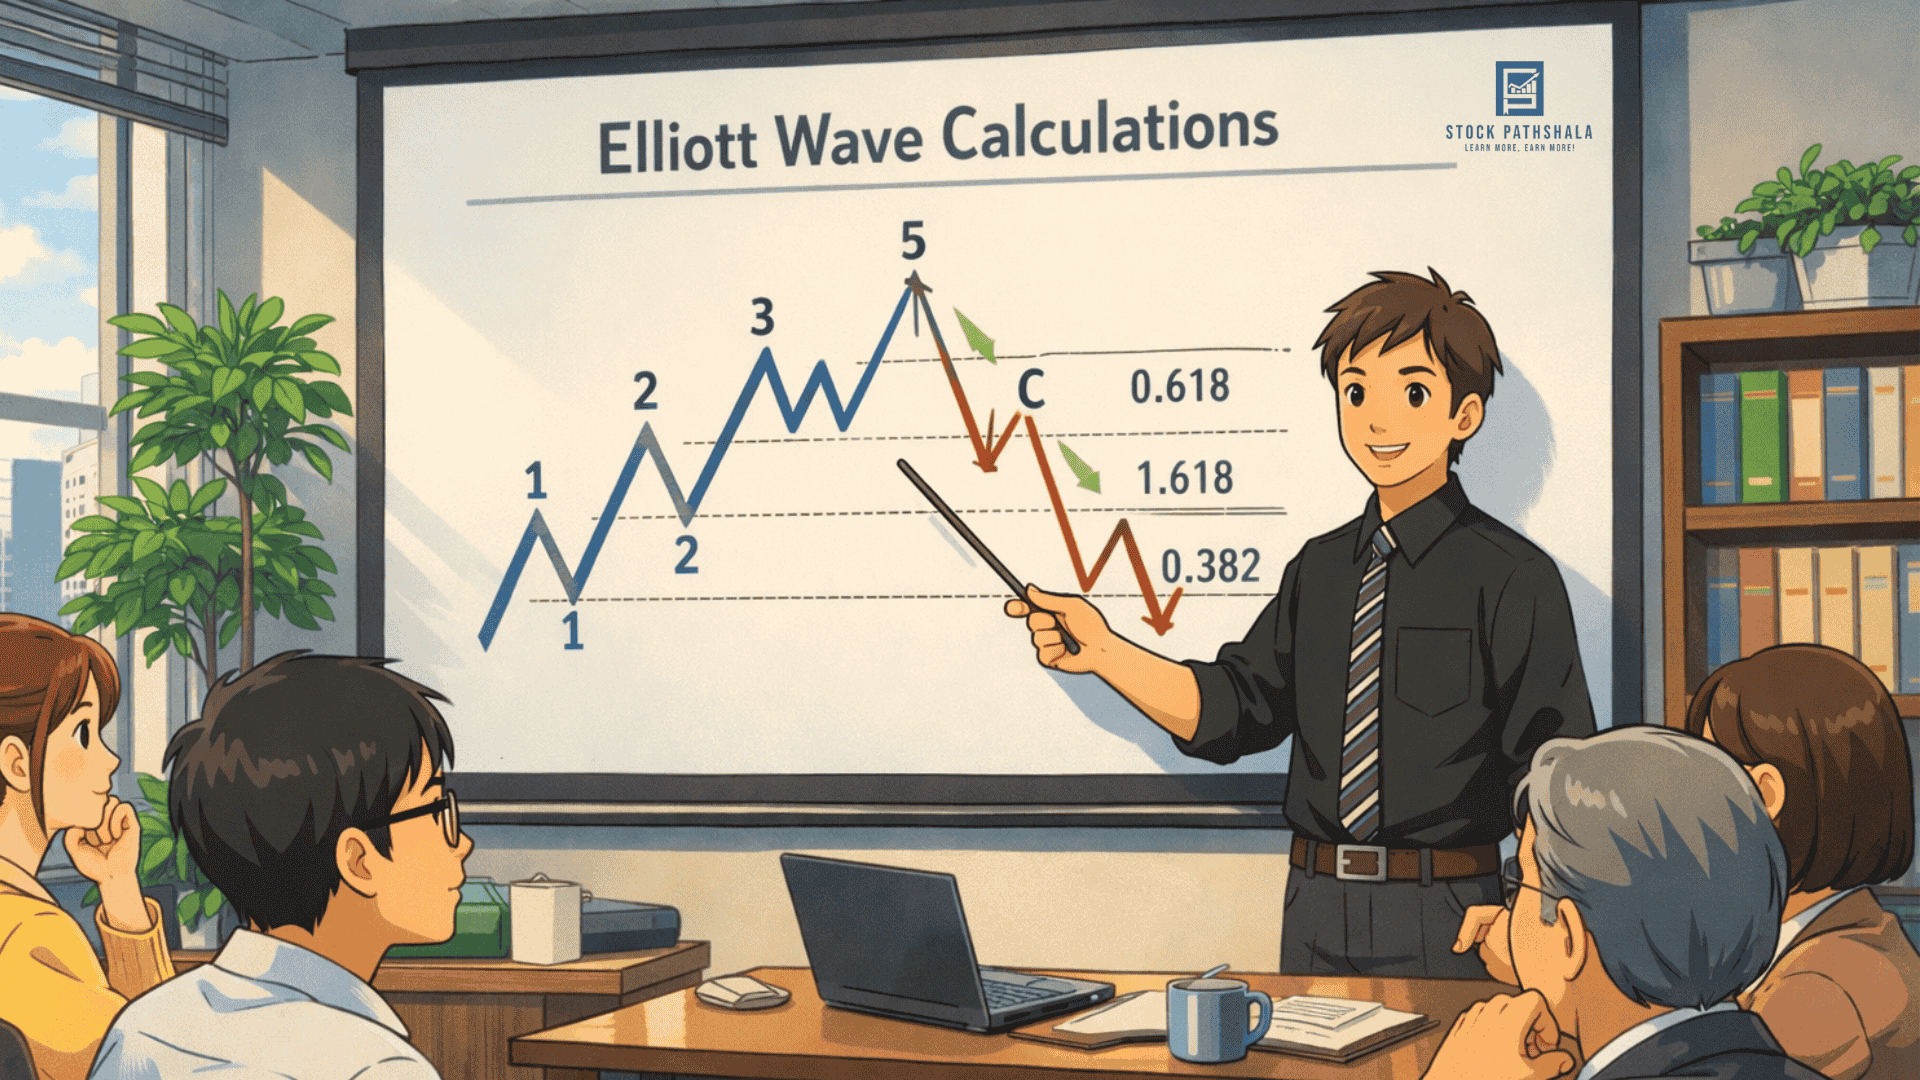
So, let us understand Elliott wave calculations through this blog.
Understanding The Basics Of Elliott Wave Theory
The structure is something one would want to know before indulging in numbers.
Elliott Wave Theory is a trading theory that was proposed in the 1930s, where Ralph Nelson Elliott argued that markets went through repeated cycles in which waves occurred.
The trend is usually a 5-wave impulse wave pattern and a 3-wave correction.
Impulse Waves
The five-wave trend structure looks like this:
| Wave | Direction | Description |
| Wave 1 | Up | Initial move as early buyers enter |
| Wave 2 | Down | Partial retracement |
| Wave 3 | Up | Usually the strongest move |
| Wave 4 | Down | Consolidation |
| Wave 5 | Up | Final push before correction |
Corrective Waves
After the impulse, the market often forms a three-wave correction.
This cycle represents the core difference between Impulsive vs Corrective wave behavior, where the former drives the trend, and the latter pauses it.
| Wave | Direction | Description |
| Wave A | Down | First corrective drop |
| Wave B | Up | Temporary rebound |
| Wave C | Down | Final correction |
The role of Elliott wave calculations is to measure these waves and estimate how far the next move may travel.
Learning how to do Elliott wave analysis correctly ensures that these projections are based on valid wave counts rather than guesswork.
Elliott Wave Rules
A trader has to first confirm that the wave count is valid before calculating targets or using Fibonacci projections. Consider these three rules as a gatekeeper.
The failure to comply with a single rule renders the count of waves invalid, and no calculation is meaningful.
This is one of the steps that many beginners overlook and eventually set goals on the wrong structures.
Some of the Elliott Wave rules to examine initially:
- Wave 2 cannot retrace more than 100 percent of Wave 1, meaning it cannot fall below Wave 1’s starting point.
- Wave 3 cannot be the shortest among Wave 1, Wave 3, and Wave 5. It is primarily the most forceful move.
- The price territory of Wave 1 may not be overlapped by Wave 4, save in exceptional cases, such as diagonal triangle pattern.
Elliott Wave Calculation Formula Explained
Now the practical part. Traders rely heavily on Fibonacci ratios when performing an Elliott wave calculation formula.
Why Fibonacci numbers? Markets tend to respect them surprisingly often.
Common Fibonacci Ratios
| Wave | Fibonacci Level | What It Means |
| Wave 2 retracement | 50%–61.8% of Wave 1 | Common pullback before Wave 3 |
| Wave 3 extension | 161.8% of Wave 1 | Most common Wave 3 target |
| Wave 4 retracement | 23.6%–38.2% of Wave 3 | Shallow correction before Wave 5 |
| Wave 5 projection | Equal to Wave 1, or 61.8% of Wave 1 | Final push before correction |
Basic Elliott Wave Calculation Formula
Traders usually measure waves using simple projection math.
Wave Target = Previous Wave Length × Fibonacci Ratio
Example:
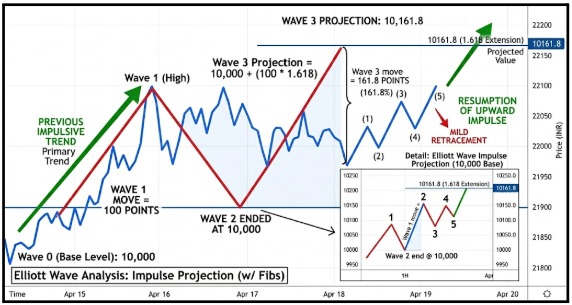
- Wave 1 move = 100 points
- Fibonacci extension for Wave 3 = 161.8%
Calculation:
100 × 1.618 = 161.8 points
If Wave 2 ended at 10,000, the Wave 3 projection becomes:
10,000 + 161.8 = 10,161.8
This simple calculation forms the backbone of many trading strategies.
How To Identify The Correct Starting Point For Calculations?
Before applying any Elliott Wave formula, traders must first anchor the calculation correctly on the chart. The rule is simple but often overlooked.
Every new wave projection begins from the end of the previous confirmed wave. If this starting point is wrong, the price targets can become completely inaccurate.
The main considerations that traders must keep in mind:
- To draw Wave 3 projections, a length of Wave 1 is measured, then the Fibonacci extension is applied and added at the end of Wave 2.
- Apply Fibonacci retracement by dragging the tool at the beginning of Wave 1 till its end.
- Apply the Fibonacci extension using the three points, namely: Wave 1 start, Wave 1 end, and Wave 2 end.
- Most beginner mistakes happen when traders choose the wrong starting point, which leads to unrealistic targets.
Step-by-Step Elliott Wave Calculations On A Hypothetical Chart
Let us walk through a simple chart scenario to understand the Elliott wave calculations better.

Now, from this chart, we know that RELIANCE moves like this:
| Wave | Price Movement |
| Wave 1 | 100 to 120 |
| Wave 2 | Pullback to 110 |
Now traders project Wave 3.
Step 1: Measure Wave 1
Step one will always be measuring the Wave 1 length. This is done by this simple calculation:
- 120 − 100 = 20 points
Step 2: Apply Fibonacci Extension
Common Wave 3 targets:
- 161.8 percent extension
- 200 percent extension
Using 161.8 percent:
20 × 1.618 = 32.36 points
Step 3: Add Projection
Wave 2 ended at 110.
- 110 + 32.36 = 142.36
So Wave 3 target sits near 142.
Step 4: Elliot Wave 4th Wave Retracement
Wave 4 often retraces:
- 23.6 percent
- 38.2 percent
Example:
- Wave 3 length = 32 points
38.2 percent retracement:
- 32 × 0.382 = 12.22
If Wave 3 ends at 142:
- 142 − 12 ≈ 130
That becomes a potential Wave 4 support zone.
Step 5: Estimate Wave 5
Wave 5 commonly equals Wave 1 in length, though this is a guideline rather than a fixed rule.
- Wave 1 = 20 points (100 to 120)
- Wave 4 ended near 130.
- Wave 5 projection: 130 + 20 = 150
That gives a potential Wave 5 target of 150 on Reliance.
Conservative traders take partial profits near Wave 5’s projected end and watch for the ABC correction to follow.
Elliott Wave Calculations For Corrective Waves (A B C)
Following a robust five-wave drive, markets tend to correct into three waves, which are labeled A, B, and C.
Traders normally approximate the termination of these waves in terms of Fibonacci retracement and extension levels.
When applying the ABC correction rules of Elliot wave, remember that corrective waves are calculated in the same Fibonacci ratios as impulse waves, just in reverse form.
The most important rules that traders consider when calculating:
- Wave A usually retraces 50% to 61.8% of the preceding impulse move.
- The retracement of Wave B typically ranges between 38.2 percent and 61.8 percent of Wave A in a zigzag correction. However, in a flat correction, Wave B can retrace 90 percent to 100 percent or more of Wave A, so the range varies depending on the correction pattern.
- Wave C may often increase to 100 percent of Wave A, and in more severe corrections, may reach 161.8 percent.
Example:
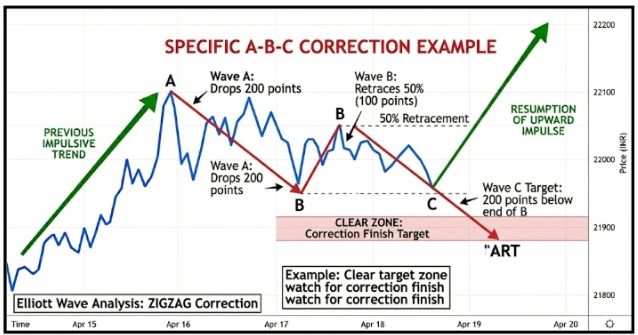
- Nifty rallies and then begins a correction.
- Wave A drops 200 points.
- Wave B retraces 50 percent, recovering 100 points.
- Wave C target becomes 200 points below Wave B’s end, giving traders a clear zone to watch for the correction to finish.
Using An Elliott Wave Calculator In Real Trading
Many traders prefer automation. A good Elliott wave calculator simplifies these projections.
Popular trading platforms already include built-in tools.
Examples include:
- TradingView Fibonacci extensions.
- MetaTrader Fibonacci tool.
- Advanced wave software like ELWAVE.
These tools automatically generate targets once you mark Wave 1 and Wave 2.
Typical outputs include:
- Wave 3 projections
- Wave 5 estimates
- Correction targets
Still, software cannot replace judgment. Markets often create alternate counts, so traders must stay flexible.
Elliott Wave Calculator For Intraday Trading
Intraday traders also apply elliott wave calculator for intraday setups. Short timeframes create smaller waves, but the logic remains identical.
Example: Intraday Nifty Trade
Nifty moves:
| Move | Price |
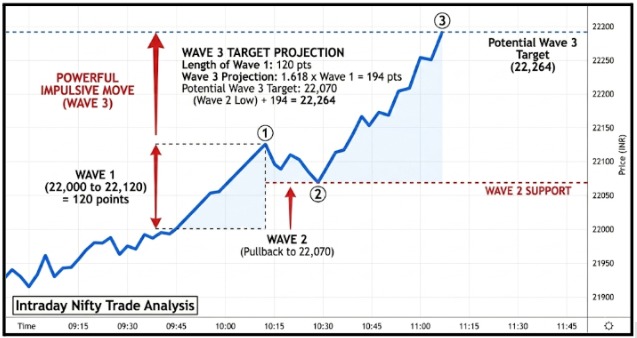
| Wave 1 | 22,000 to 22,120 |
| Wave 2 | Pullback to 22,070 |
Wave 1 length:
- 120 points
Wave 3 projection:
- 120 × 1.618 = 194
Potential Wave 3 target:
- 22,070 + 194 = 22,264
Intraday traders then watch:
- Volume expansion
- Momentum indicators
- Resistance levels
If the market approaches the projection with strong buying pressure, the wave structure remains valid.
If momentum fades early, the count may be wrong. Flexibility matters.
Risk Management While Using Elliott Wave Calculations
Here is the truth. Wave counting is partly analytical and partly interpretative. Two experienced traders might see different counts on the same chart.
That is why risk management remains essential.
Practical risk rules traders follow:
- Always place a stop below Wave 2 in impulse trades.
- Avoid trading Wave B corrections because they are erratic.
- Use Fibonacci clusters for stronger price targets.
- Confirm with indicators like RSI or volume.
A trader might say Elliott Waves predict the future. That is slightly exaggerated. They offer probability zones, not guarantees.
Still, when the structure lines up well, the market sometimes moves exactly as projected. Those moments remind traders why they keep studying wave behavior.
Conclusion
Elliott wave calculations help traders make sense of price movements that would otherwise seem random.
By using wave patterns and Fibonacci ratios together, traders can identify potential price targets and retracement zones with much better clarity.
An Elliott wave calculator makes this process more manageable, especially when tracking multiple charts during live market hours.
One thing to keep in mind, though. Markets do not always follow textbook wave structures. Counts can differ, waves can extend, and alternate scenarios are always possible.
So treat these calculations as a guide rather than a guarantee.
Always back them up with proper risk management and confirm your wave count with supporting indicators like RSI or volume before entering any trade.
Want to master Elliott Wave calculations with real chart examples?
You can join our Elliot wave classes designed for practical market learning.
FAQs
Q1: Can Elliott Wave Calculations Work In Sideways Markets?
Ans: They can, but the results are less reliable.
Sideways markets often form complex corrective patterns, which makes these calculations harder to interpret and easier to miscount.
Q2: Why Do Traders Sometimes Get Different Wave Counts On The Same Chart?
Ans: Wave structures can be subjective.
Two traders may interpret the start or end of a wave differently, which changes the Elliott wave calculation formula and leads to alternate projections.
Q3: Is An Elliott Wave Calculator Enough For Trade Decisions?
Ans: No. An Elliott wave calculator makes the target estimates, and it is common practice among traders to validate the signals using volume, support, and resistance, or momentum indicators before engaging in a trade.
Before investing capital, invest your time in learning Stock Market.
Fill in the basic details below and a callback will be arranged for more information:


