
Markets move in waves. Prices surge, pause, correct, then push again. Traders who understand this rhythm often gain a clearer view of where the price may head next.
That is where Elliott Wave analysis becomes useful. It helps traders study repeating market patterns shaped by crowd psychology.
This guide provides a step-by-step method of the Elliott Wave analysis, which is presented using practical chart rationale and real trading situations.
What Is Elliott Wave Analysis?
Before applying the method, traders must understand the basic idea.
Elliott Wave Analysis is applied in technical analysis and was invented by Ralph Nelson Elliott during the 1930s.
He published his findings in his 1938 book ‘The Wave Principle’ and later expanded the theory in ‘Nature’s Law’ in 1946.
His work laid the foundation for one of the most widely studied concepts in technical analysis.
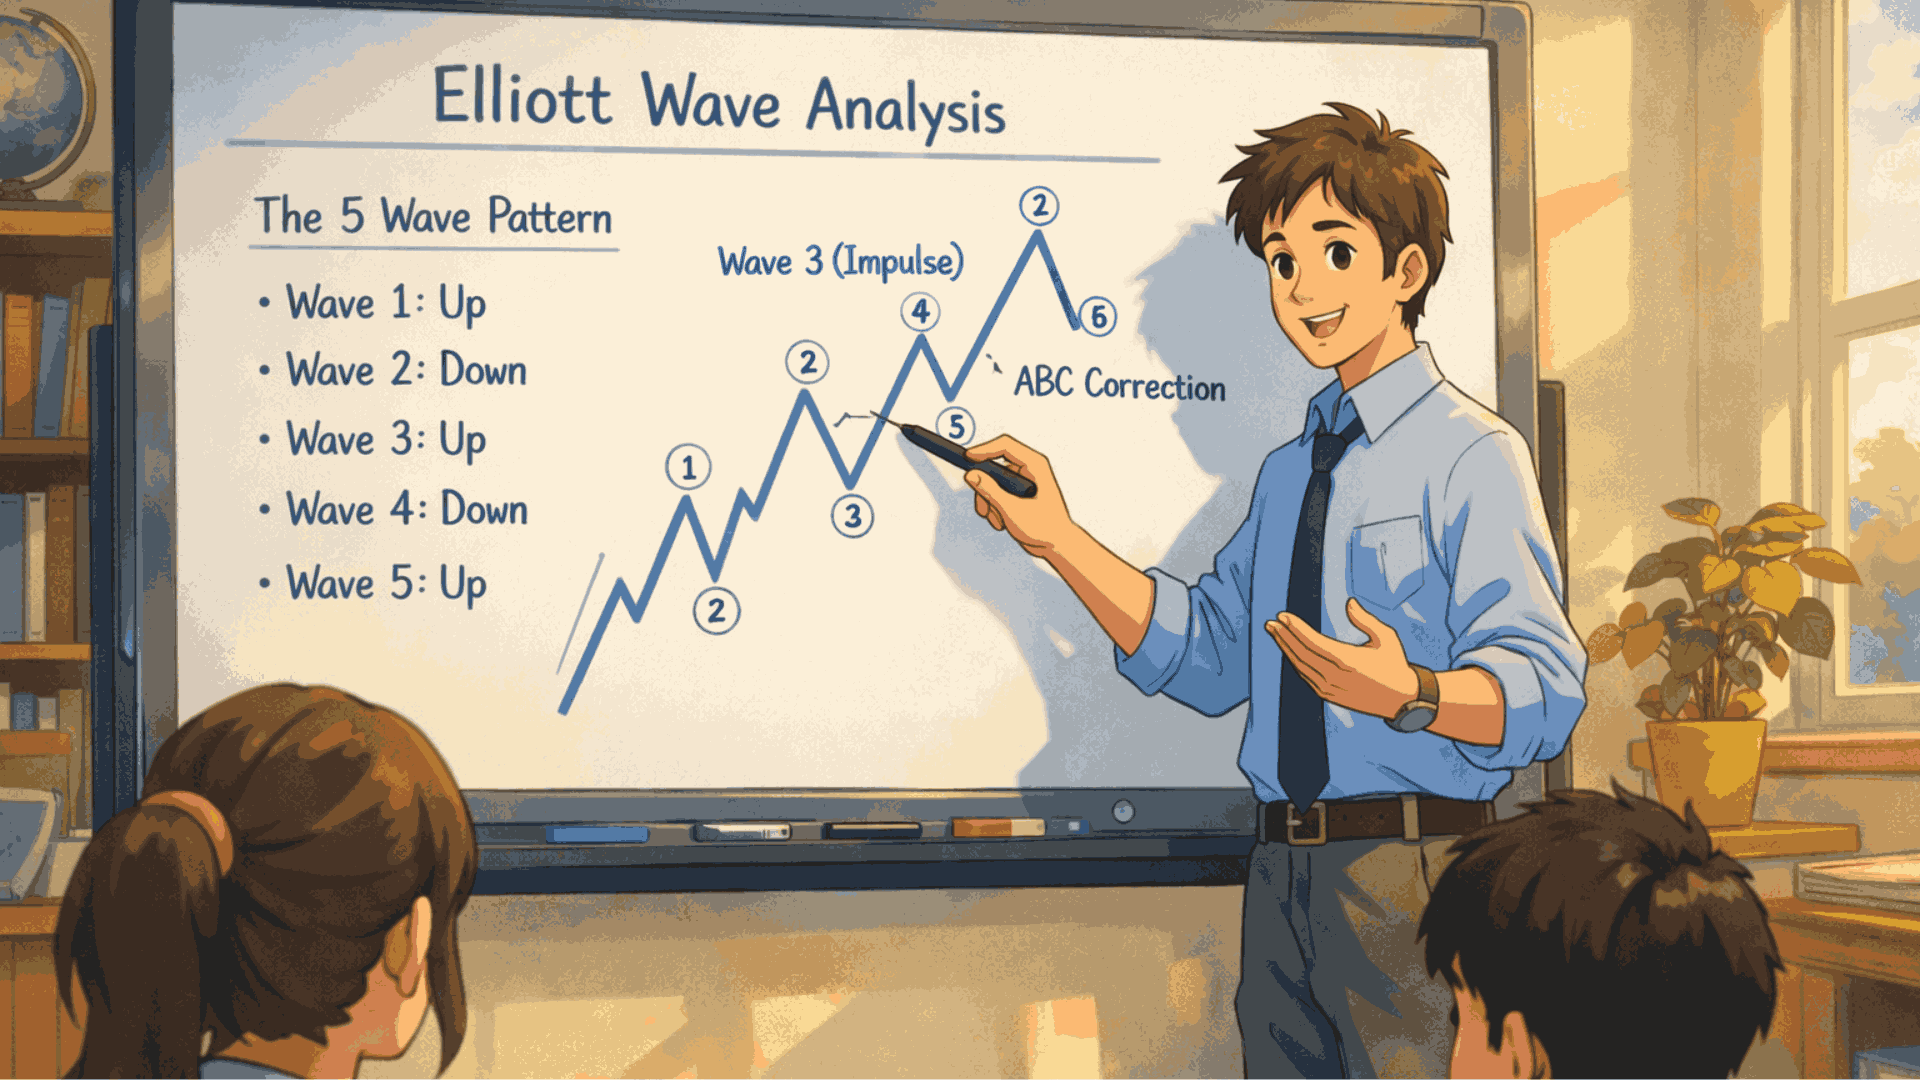
The theory suggests that market trends develop in an Elliott Wave Chart Pattern, which consists of five impulse waves followed by three corrective waves.
This visual blueprint helps traders categorize market movements based on their position within a larger cycle.
|
Wave Type |
Direction |
Purpose |
|
Wave 1 |
Trend Direction | First move of a new trend |
| Wave 2 | Against Trend |
Pullback after the first move |
|
Wave 3 |
Trend Direction | Usually, the strongest wave |
| Wave 4 | Against Trend |
Consolidation |
|
Wave 5 |
Trend Direction | Final push of the trend |
| Wave A B C | Correction |
Market retraces previous trend |
A full cycle, therefore, contains 8 waves.
This is presented in numerous markets, including stocks, forex, crypto, and commodities.
Elliott Wave Rules Vs Guidelines
The biggest error that people new to Elliott Wave analysis commit is equating all principles as being equally strict.
In an actual sense, this theory isolates the guidelines and rules, and it is necessary to know the difference between rules and guidelines in order to count the waves properly.
Rules are absolute and can never be broken, whereas guidelines are tendencies that assist analysts in taking the most logical interpretation of the wave.
|
Rules (Non-Negotiable) |
Guidelines (Tendencies) |
|
Wave 2 can not retrace over 100 percent of Wave 1 |
Fibonacci retracement levels |
|
Wave 3 cannot be the shortest among Waves 1, 3, and 5 |
Wave alternation patterns |
| Wave 4 cannot overlap Wave 1 territory (except diagonals) |
Channeling techniques |
Note: A diagonal triangle pattern is a special wave pattern that resembles a wedge shape on the chart.
It typically appears in Wave 5 or Wave C and is the only case where Wave 4 is allowed to overlap Wave 1 territory.
Recognizing diagonal triangles prevents analysts from incorrectly invalidating an otherwise valid wave count.
When several counts seem possible, traders usually select the count that satisfies the maximum number of guidelines, while keeping another as an alternate scenario.
This distinction helps prevent constant miscounting and improves decision-making on real charts.
How To Do Elliott Wave Analysis: Step By Step?
Learning how to do Elliott Wave analysis becomes easier when broken into a simple routine.
The traders are not guessing the direction that the market is taking; they use a systematic approach and various Elliott wave strategies for trading to observe the direction that the price waves are taking and know which direction the trend might be moving.
Step 1: Identify The Primary Trend
Start with higher time frames.
While beginners often ask which time frame is best for Elliott Wave, the answer depends on your trading style, though daily or weekly charts usually show clearer structures than smaller time frames.
Look for a clear direction:
- Higher highs and higher lows suggest an uptrend
- Lower highs and lower lows suggest a downtrend
This gives the foundation for wave labeling.
Step 2: Mark The Five Impulse Waves
Next, locate the five-wave structure moving in the trend direction.
Important rules:
- Wave 2 cannot drop below the Wave 1 start
- Wave 3 cannot be the shortest impulse wave
- Wave 4 usually does not overlap with Wave 1
Example scenario:
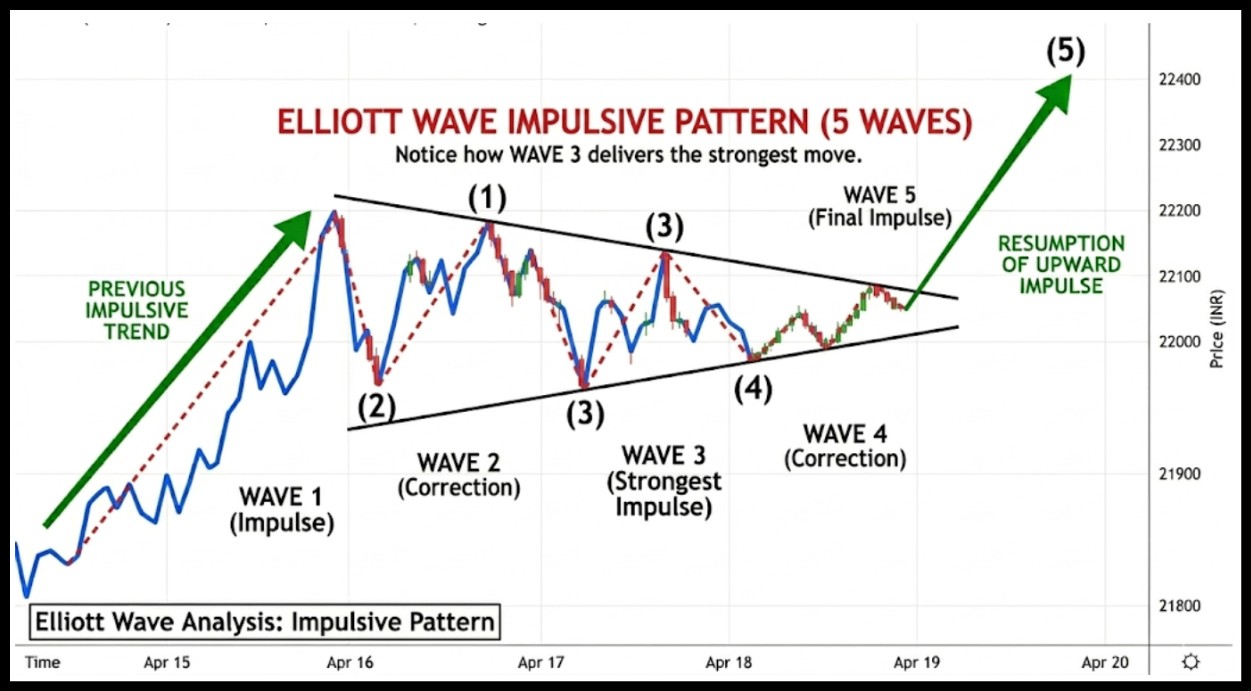
Notice how Wave 3 delivers the strongest move.
|
Wave |
Price Example |
|
Wave 1 |
Stock rises from 100 to 120 |
|
Wave 2 |
Pullback to 110 |
|
Wave 3 |
Rally to 160 |
|
Wave 4 |
Correction to 145 |
|
Wave 5 |
Final push to 170 |
Step 3: Track Corrective Waves
After five waves, the market enters a corrective phase. The most common form is an ABC correction. However, corrections can also take other forms, such as zigzags, flats, triangles, and complex combinations.
Identifying the correct corrective structure is just as important as counting impulse waves. The typical pattern is:
- Wave A begins the decline
- Wave B retraces part of the drop
- Wave C completes the correction
Corrections often retrace 38 percent to 61 percent of the previous trend.
The Alternation Rule: The Principle of Alternation helps traders anticipate the form of upcoming corrections.
When Wave 2 makes a sharp correction, which is most likely a zigzag, then Wave 4 tends to revert to a sideways pattern, e.g., a flat or triangle.
This occurs in a majority of instances and provides the analysts with insight into the nature of corrections that can be seen in the future.
In practical analysis, once Wave 2 is identified, traders start watching for a different structure in Wave 4 rather than expecting the same pattern again.
Step 4: Confirm With Fibonacci Levels
Many traders combine Elliott waves with Fibonacci retracements. Elliott wave calculations often rely on these ratios to identify high-probability reversal zones.
Common retracement levels:
|
Fibonacci Level |
Typical Wave Behavior |
|
38.2 percent |
Shallow corrections |
|
50 percent |
Moderate retracement |
| 61.8 percent |
Deep pullback |
For example:
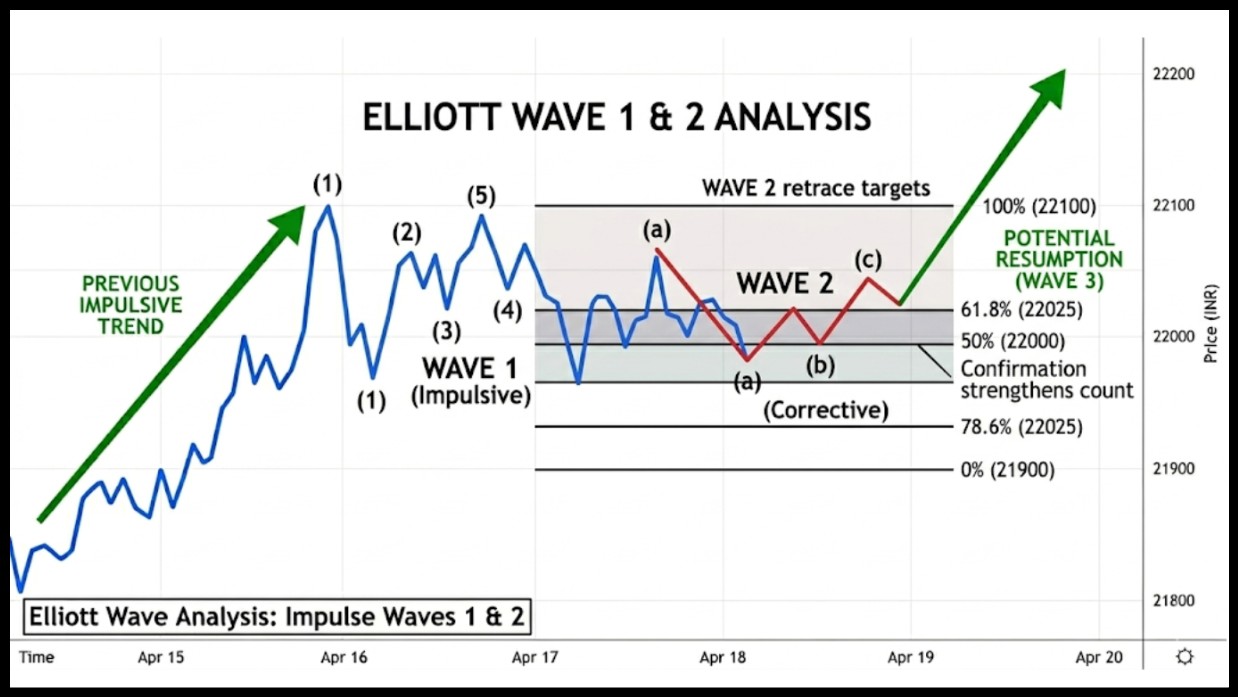
Wave 2 commonly retraces between 50 percent and 61.8 percent of Wave 1. However, it can retrace anywhere from 38.2 percent to nearly 100 percent of Wave 1 without violating Elliott Wave rules.
Deeper retracements are less common but entirely valid.
This confirmation strengthens the wave count.
How Does Elliott Wave Analysis Work?
Elliott Wave Theory is fundamentally the psychology of investors. Prices go up when traders get optimistic.
These emotional cycles create wave patterns.
A typical bullish cycle works like this:
- Early buyers enter the market. Price rises slightly.
- Some traders make a profit. Price pulls back.
- Confidence grows. A strong rally begins.
- Market pauses.
- Final buyers push the price to a peak.
- A correction begins.
This repeating structure is why traders try to label waves on charts.
Platforms like TradingView and MetaTrader 5 allow analysts to mark these waves visually. Still, labeling waves correctly requires practice.
Price movements reflect crowd behavior. Elliott waves simply organize that behavior into recognizable phases.
Think of it like market mood swings.
|
Market Phase |
Trader Emotion |
| Wave 1 |
Early optimism |
|
Wave 2 |
Doubt |
|
Wave 3 |
Strong confidence |
| Wave 4 |
Uncertainty |
|
Wave 5 |
Euphoria |
| ABC |
Fear and profit-taking |
Wave 3 is often the most powerful because the majority of traders finally accept the trend.
Many professional traders focus on catching Wave 3 moves since they usually deliver the biggest profits.
Note: During wave 5, Euphoria among retail traders, but momentum weakens, and smart money begins distributing.
Elliott Wave Time Analysis
Price patterns are only part of the story. Time also matters. Elliott wave time analysis studies how long each wave lasts.
By observing Elliott Wave Time Cycles, traders can identify the recurring temporal patterns that suggest when a move is due for completion.
Markets often show symmetry:
- Wave 3 may last longer than Wave 1
- Corrective waves often take less time than impulse waves
Example:
|
Wave |
Time Duration |
|
Wave 1 |
5 trading days |
| Wave 2 |
3 days |
|
Wave 3 |
12 days |
| Wave 4 |
4 days |
|
Wave 5 |
7 days |
If a wave takes unusually long, traders reconsider their wave count.
If a wave you have labeled Wave 3 appears shorter in time than Wave 1, consider recounting.
Generally, Wave 3 tends to be longer in both price and time, though in fast-moving markets it can be brief in duration while still being the largest in price movement.
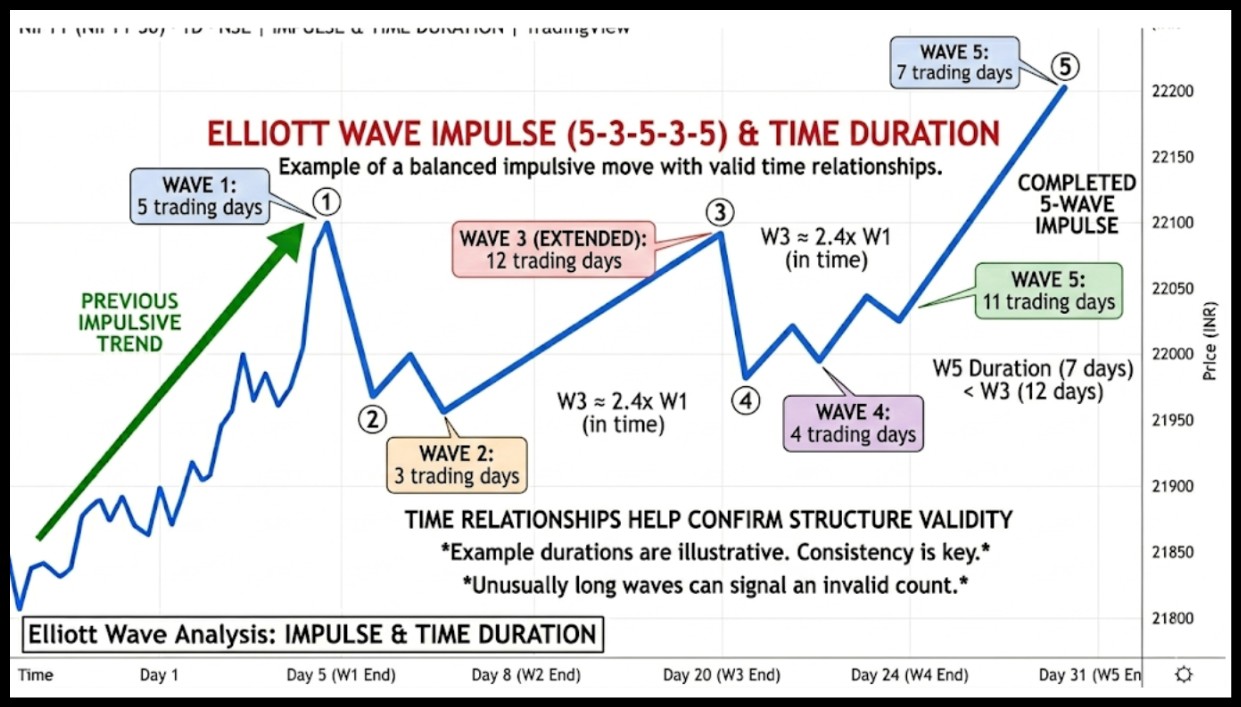
Time relationships help confirm whether a structure is valid.
Advanced Elliott Wave Analysis Techniques
Once traders understand basic waves, they move to advanced Elliott wave analysis.
These methods refine trade timing.
1. Multi-Time Frame Wave Counting
Professionals study multiple charts:
- Monthly trend
- Daily structure
- Hourly entry
A small wave on a daily chart may be part of a much larger weekly wave.
2. Wave Extensions
Wave extensions occur when one of the impulse waves, typically Wave 1, Wave 3, or Wave 5, stretches significantly beyond normal expectations.
Wave 3 extensions are the most common and are frequently seen in crypto and commodity markets during strong trending phases.
Traders use Fibonacci ratios to project extension targets:
|
Fibonacci Ratio |
Extension Strength |
| 161.8% |
Moderate Wave extension |
|
261.8% |
Strong Wave extension |
| 423.6% |
Extremely powerful move |
When a Wave 3 extension occurs, Wave 1 and Wave 5 tend to be roughly equal in length. This relationship helps traders set realistic profit targets during extend
3. Channeling Technique
Channeling is a useful Elliott Wave tool that is employed by estimating the location where upcoming waves might terminate.
Using straight parallel trendlines, traders are able to visualize the possible support and resistance levels where Wave 3 may end, or Wave 5 may end.
Basic Channeling Steps:
- Projecting Wave 3 Target
- Draw a trendline from the start of Wave 1 to the end of Wave 2
- Then, draw a parallel line from the end of Wave 1
- This upper channel line often provides a rough target for Wave 3
- Projecting Wave 5 Target
- Draw a trendline from the start of Wave 3 to the end of Wave 4
- Copy a parallel line from the end of Wave 3
- This channel boundary can indicate where Wave 5 may terminate
In practice, traders apply this technique on charting platforms like TradingView to visually track wave progress and anticipate potential reversal zones.
How To Maintain An Alternate Wave Count?
Professional Elliott Wave analysis never relies on a single interpretation. Markets can form multiple valid wave counts, so traders maintain both a primary count and an alternate count.
Each count has a clear invalidation level. If the price breaks that level, the primary view is discarded, and the alternative becomes active.
Key Practices:
- Maintain a primary and alternate wave count
- Mark the exact invalidation price level
- Switch bias when that level breaks
- Review counts as new price data forms
Common Mistakes During Elliot Wave Analysis
Applying Elliott Wave analysis incorrectly is easy for beginners. The most common mistakes include:
- Forcing waves on choppy charts: Elliott Wave works best in trending markets. Avoid labeling waves when price movement is unclear.
- Ignoring higher timeframe trends: Always confirm the bigger trend before counting waves on smaller timeframes.
- Treating every correction as ABC: Corrections come in multiple forms, including flats, zigzags, and triangles.
- Trading every wave: Focus on Wave 3 setups, which offer the best risk-to-reward ratio.
- Skipping invalidation levels: Every count needs a clear price level where it becomes invalid.
Patience and practice remain the two most important tools in wave analysis.
Practical Trading Example
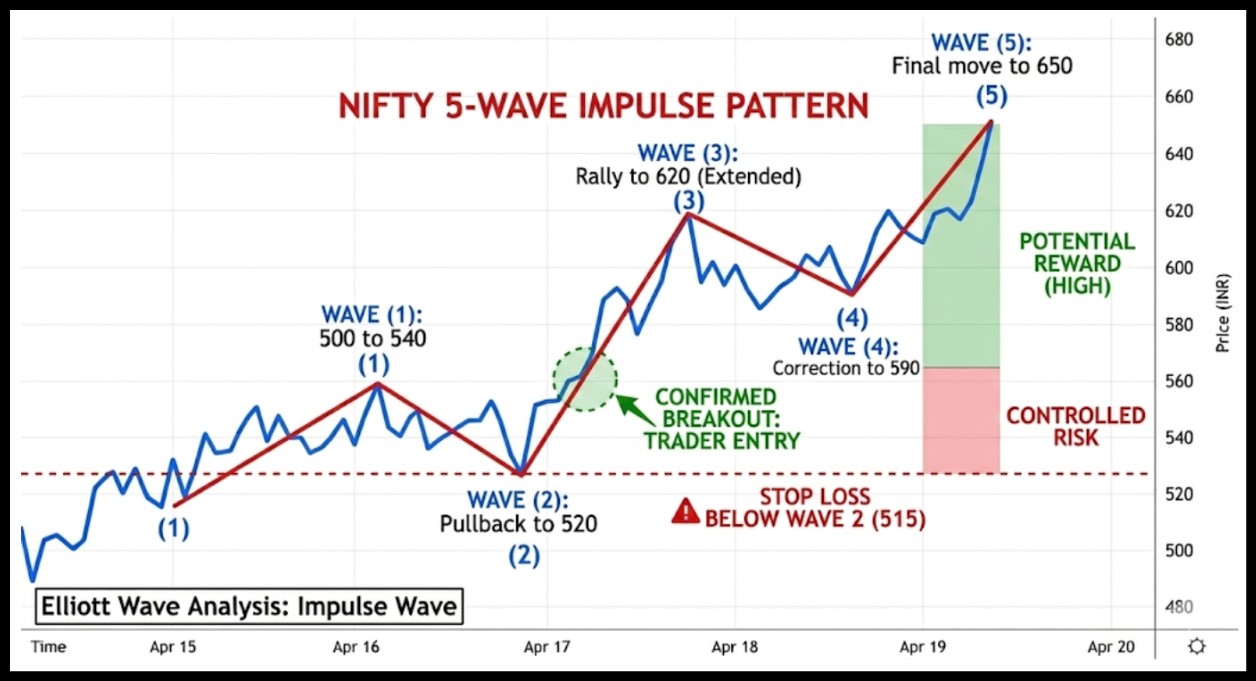
Consider a stock trading near 500.
A trader observes the following:
|
Wave |
Price Movement |
|
Wave 1 |
500 to 540 |
|
Wave 2 |
Pullback to 520 |
|
Wave 3 |
Rally to 620 |
|
Wave 4 |
Correction to 590 |
|
Wave 5 |
Final move to 650 |
A Wave 3 entry is typically confirmed by the following signals:
- Price breaks and closes above the high of Wave 1
- A noticeable surge in trading volume accompanies the breakout
- Fibonacci confluence exists near the entry point, such as the 61.8% retracement of Wave 2, aligning with a key support level.
Waiting for these confirmation signals reduces the risk of entering too early and helps ensure the wave count is valid before committing capital.
Stop loss sits below Wave 2. Risk stays controlled while potential reward remains high. This is how many professional traders apply Elliott waves in real markets.
Conclusion
Elliott Wave Theory offers a structured way to read market movements. It blends price action, psychology, and pattern recognition.
Learning how to do Elliott Wave analysis takes time. Charts must be studied repeatedly. Even seasoned analysts often need to adjust their wave counts.
The framework, however, remains powerful.
When combined with tools like Fibonacci retracements and trend analysis, Elliott Waves can help identify high-probability setups while managing risk effectively.
Markets don’t reward guesses; they reward clarity built over time.
If you want to develop that clarity through real-time practice, join our live stock market classes, where you learn to read waves as they form, not after they’re gone.
FAQs
Q1: Is Elliott Wave Analysis Reliable?
Ans: It may be useful with the other tools, such as support levels and Fibonacci retracements. But there are also counts of waves that are subjective and cannot be acquired without experience.
Q2: Which Markets Work Best For Elliott Waves?
Ans: The method works in stocks, forex, crypto, and commodities. Markets with strong trends often produce clearer wave structures.
Q3: Why Do Traders Sometimes Change Their Elliott Wave Count?
Ans: The wave counts evolve when new price data discards the old price structure.
When price fails to follow a major principle, as in the example of Wave 2 falling below the point of the Wave 1 base, then the analysis should be redone to reflect the new market configuration.
Before investing capital, invest your time in learning Stock Market.
Fill in the basic details below and a callback will be arranged for more information:


