

Imagine watching the market move like ocean waves. Some waves crash hard, others roll gently. What if you could read those waves to make smarter trading choices?
That’s exactly what the Elliott wave forecast is all about. Traders swear by it because it gives structure to otherwise chaotic price moves.
Let’s break it down.
What Is Elliott Wave Forecast?
At its core, what is Elliott Wave Forecast?
In simple terms, it means using patterns to understand future price movement. Think of it like reading ripples before a tsunami or a lull.
Since markets move in patterns of optimism and fear. Ralph Nelson Elliott noticed this in the 1930’s when he studied stock prices and found repeated cycles.
Let’s understand this with an example:
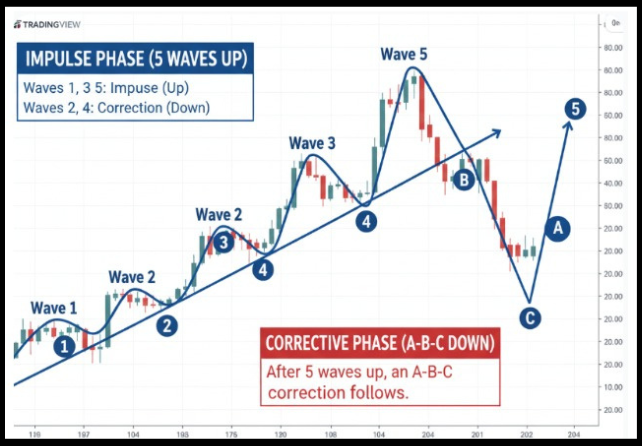
If the market is climbing, it tends to do 5 waves up and then 3 waves down.
- Waves 1, 3, and 5 go up (Impulse): This Impulse wave pattern moves strongly in the main direction of the trend, showing clear buying strength and momentum.
- Waves 2 and 4 move down a bit (Correction): These are corrective waves, which means they temporarily move against the main trend as traders take profits before the trend continues.
- A-B-C corrective phase kicks in: This A-B-C phase is a larger correction, where the market pauses or pulls back more deeply before deciding its next major direction.
Simple on paper, but powerful in real trade setups.
Elliott Wave Forecast Theory
Now, based on the above example, it is clear that Elliott wave forecast theory says psychology drives prices.
Simple human emotions like fear and greed don’t stay random; they repeat.
To use the forecast properly, there are certain guidelines, and Elliott wave 4 rules you can’t ignore:
- Wave 2 never retraces beyond the start of Wave 1
- Wave 3 is never the shortest impulse wave
- Wave 4 cannot enter the price territory of Wave 1
These sound strict, and hey, they are. But that precision gives you reliable clues.
If you spot a valid 5-wave pattern, you’re not guessing; you’re reading psychology. Traders then use this to anticipate corrections or trend continuation.
How does Elliott Wave Forecast Nifty?
If you trade the Nifty index, you’ll see waves everywhere.
Why Nifty is a great market for wave forecast:
- High liquidity
- Clear trends
- Emotional collective behavior
Indian traders use the wave forecast to spot:
- Reversal points
- Long-term trend exhaustion
- Corrective patterns
Let’s apply it practically on the chart to understand:
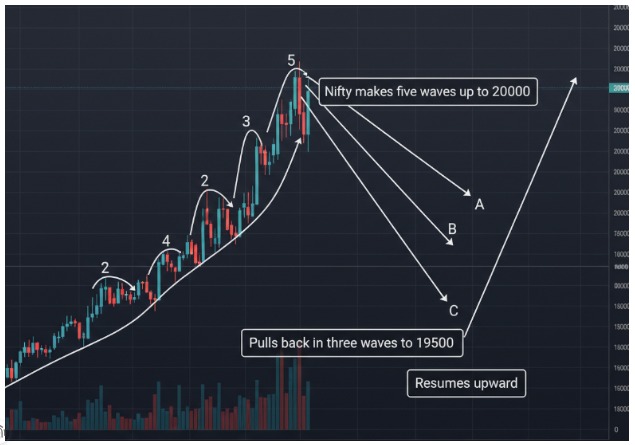
This chart shows how traders use Elliott Wave Theory to understand and forecast movements in the NIFTY 50.
Step 1: The Market Moves in 5 Waves Up
According to Elliott Wave, when the market is in an uptrend, it usually moves in five waves.
In the image, Nifty rises step-by-step:
- Wave 1: The market starts moving up as a few buyers enter.
- Wave 2: Price pulls back a little because some traders take profits.
- Wave 3: This is usually the strongest move up, when many traders join the trend.
- Wave 4: Another small pause or correction.
- Wave 5: The final push upward before the trend gets tired.
In this example, Nifty completes these five waves and reaches around 20,000.
Step 2: A 3-Wave Correction Happens
After a strong move, the market usually takes a break.
Instead of continuing up immediately, it moves in three corrective waves (A-B-C).
This specific corrective pattern can take several forms; sometimes, instead of a sharp drop, the market moves sideways in an Elliott Wave flat correction, which can trick impatient traders.
These are labeled:
- Wave A: The first drop when selling begins.
- Wave B: A temporary bounce where people think the uptrend will continue.
- Wave C: The final drop that completes the correction.
In the chart, this correction pulls Nifty back toward 19,500.
Step 3: The Trend Can Continue
Once the correction finishes, the market often starts moving up again.
That’s why the arrow in the chart shows Nifty resuming the upward trend after the ABC correction.
The Simple Idea:
Elliott Wave is basically helping traders answer three questions:
- Where is the trend starting?
- Where might the market take a pause or correction?
- When could the next move begin?
Instead of guessing, traders try to read the pattern of crowd behavior in the market. With practice, these wave structures become easier to spot and can help in planning better trades.
How To Read Elliot Wave Patterns?
Here’s the most real part: charts lie sometimes. And humans misread charts sometimes, too.
So what do veteran wave analysts do?
They Use Fusion
This involves combining Elliott Wave with Fibonacci levels to find exact price targets.
They also incorporate Elliott Wave time analysis to predict not just where the market goes, but when it will get there.
Meaning:
- Combine Fibonacci ratios with wave counts
- Check volume behavior
- Watch time cycles
A valid wave count often respects more than one discipline.
Gentle Reminder
Wave analysis is not a guarantee. It’s a probability tool.
Common Mistakes Traders Make With Elliott Wave Forecast
Even skilled traders slip up. Many beginners ask, does Elliott Wave theory work in every scenario?
It works best when you:
- Force patterns where none exist
- Ignore trend context
- Over-reliance on indicators without human judgment
Here’s a quick checklist to avoid mistakes:
- Validate wave count before trading
- Use stop-losses
- Cross-check with other indicators
- Be aware of news events
If you find the wave counts confusing, an Elliott Wave online mentorship can provide the personalized feedback needed to stop guessing and start analyzing with precision.
Conclusion
Yes, if you like seeing structure in chaos. No, if you want a crystal ball.
The strength of wave forecasting lies in its logic and human psychology foundation. It is not magic, but it’s one of the most respected technical analysis tools.
You know what?
Like learning guitar or a new language, mastering waves takes practice. Stick with it, stay curious, and always respect risk.
So, if you want to learn the stock market from the ground up, then join our stock market classes to master these advanced techniques and trade with a professional edge.
FAQs
Q1: Is Elliott wave forecasting accurate?
Ans: It’s a probabilistic tool, not a certainty; reliable when combined with other methods.
Q2: Can beginners use Elliott wave forecasts effectively?
Ans: Yes, with practice and patience, start with basic patterns before advanced structures.
Q3: Does wave forecasting work on all markets?
Ans: Generally, yes (stocks, forex, indices like Nifty), but always confirm with volume and context.
Before investing capital, invest your time in learning Stock Market.
Fill in the basic details below and a callback will be arranged for more information:


