Trends don’t last forever. They build, they stretch, and then something shifts. Momentum slows. Buyers hesitate. Sellers test the waters.
That turning point is where serious traders pay attention.
The Elliott Wave Reversal Pattern helps identify when a structured five-wave move is likely to be complete and when the market may be preparing for a meaningful change in direction.
What Is Elliott Wave Reversal Pattern?
Before we discuss setups, we need to answer the question that traders have, and that is, what is the trend reversal of the Elliott Wave?
Understanding Elliott Wave Formation is the first step to seeing these shifts clearly.
Elliott wave reversal structure occurs when a full five-wave impulse has ended, and the market is ready to take a bigger corrective impulse, or when a secondary level structure has been completed, and the price is set to resume the bigger trend.
In simple terms, mastering the difference between an Impulsive vs Corrective Wave is vital:
- Impulse waves move with the trend in 5 waves.
- Corrective waves move against the trend in 3 waves.
- A completed structure often signals a reversal.
Reversal does not mean instant crash or rally. It means probability shifts.
And that shift is where traders position themselves.
How To Identify The Elliott Wave Reversal Pattern?
Spotting it requires discipline. Identifying wave patterns isn’t about guessing; it’s about rules.
Here is how you can spot the Elliott Wave Reversal Pattern:
1. Confirm A Complete Five-Wave Structure
A valid impulse must follow core rules:
- Wave 2 does not retrace 100 percent of Wave 1
- Wave 3 is not the shortest among Waves 1, 3, and 5
- Wave 4 does not overlap with Wave 1 in standard impulses
When these rules are satisfied, and Wave 5 completes, the reversal probability increases.
2. Watch For Momentum Divergence
Indicators like RSI or MACD often show:
- Price makes a higher high
- The indicator makes a lower high
That divergence signals weakening strength.
3. Identify The First ABC Correction
The first sharp move against the prior trend often forms Wave A of a larger correction.
If price breaks below Wave 4 territory decisively, it strengthens the reversal case.
4. Change In Character: Break Of Structure
A Break of Structure occurs when price decisively breaches the previous Wave 4 low after Wave 5 completes.
This structural shift confirms momentum failure and strengthens reversal probability significantly.
How to Read Elliott Wave Reversal Pattern?
Let’s take a hypothetical NIFTY daily chart.
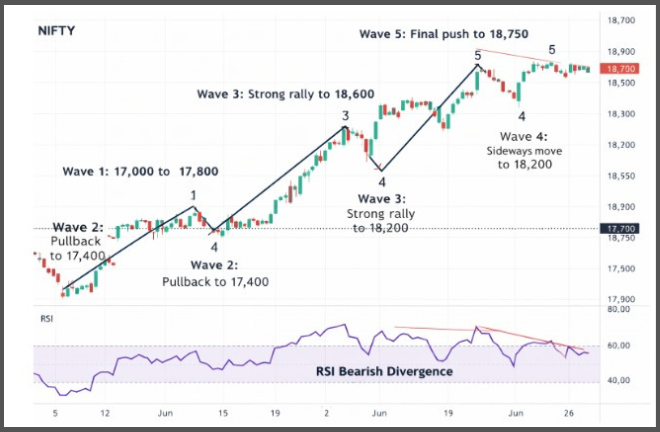
- Wave 1: 17,000 to 17,800
- Wave 2: Pullback to 17,400
- Wave 3: Strong rally to 18,600
- Wave 4: Sideways move to 18,200
- Wave 5: Final push to 18,750
RSI shows bearish divergence during Wave 5.
Soon after, the price drops sharply to 18,000. That is likely Wave A.
Here is the practical insight.
Traders who recognize the Elliott wave reversal pattern may:
- Book long profits near Wave 5
- Wait for the ABC structure to complete
- Look for short setups below Wave A
By integrating these technical signals, your Elliott Wave forecast transforms from a static chart into a dynamic trading plan.
What Is The Trend Reversal Of The Elliott Wave In Corrections?
Reversals also happen after corrective phases. After an ABC correction completes, the price often resumes the larger trend. This is a reversal in the opposite direction.
Knowing how to identify a Market Correction helps you spot these entries.
For example:
Uptrend: 5 waves complete
- ABC correction forms.
- Wave C shows a selling climax.
- Support holds near the Fibonacci 61.8 percent.
That completion can trigger trend resumption.
So the Elliott wave reversal pattern works both ways:
| Completed Structure | Likely Outcome |
| 5 Wave Impulse | ABC Correction |
| ABC Correction | New Impulse Wave |
Context matters. Degree matters.
Risk Management Around Elliott Wave Reversal Pattern
Let’s be honest. Wave counting can be subjective.
Two traders can look at the same chart and label it differently; that is the reality of technical analysis.
When a “perfect” Wave 5 extends unexpectedly, or a reversal fails to materialize, many frustrated traders ask: does elliott wave theory work, or is it just a game of shifting labels?
The truth is, the theory is a map of probabilities, not a crystal ball.
So risk control becomes essential:
- Enter only after confirmation, such as a structure break
- Placea stop above Wave 5 in a bearish reversal
- Avoid trading in the middle of Wave 3
Professional traders treat Elliott Wave as a roadmap, not a guarantee.
If Wave 5 extends unexpectedly, your stop protects you. If reversal confirms, the reward-to-risk ratio can be strong.
Common Mistakes Traders Make in Elliott Wave Reversal Pattern
Here is where many go wrong:
- Forcing wave counts to fit bias
- Shorting during strong Wave 3
- Ignoring the higher time frame structure
- Confusing correction with reversal
Wave 3 feels endless. It tempts traders to call the top early. But real reversals often happen after a clear five-wave completion, not in the middle of momentum.
Patience pays here.
Conclusion
Markets breathe in waves. As the wave cycle completes, the wave turns frequently.
The Elliott Wave Reversal Pattern will enable traders to identify that change in the early days and navigate the risk correctly, and to make rational decisions rather than emotional trades.
It is not a guarantee of perfection. But it offers structure. And in trading, structure changes everything.
Want to confidently spot Elliott Wave Reversal Patterns before the crowd does?
Join our Elliott Wave mentorship program to learn how to trade them the right way.
FAQs
Q1: What Is Elliott Wave Reversal Pattern?
Ans: It is a reversal that occurs after a completed five-wave impulse or an ABC correction, signaling a probable change in trend direction.
Q2: What is the Trend Reversal of the Elliott Wave?
Ans: Trend reversal is usually marked after the Wave 5 has exhausted itself and an ABC corrective period commences, or at the end of Wave C, leading to a new impulse commencing.
Q3: Is the Reverse Elliot Wave A Reliable Trading Wave?
Ans: It works best when combined with confirmation tools like divergence, support, resistance, and volume. Risk management remains essential.
Before investing capital, invest your time in learning Stock Market.
Fill in the basic details below and a callback will be arranged for more information: