
Price slows down before it explodes. That pause, that tight squeeze where candles shrink, and traders lose patience, is often the Elliott wave triangle pattern at work.
If you trade actively, you have seen it on NIFTY, Bank NIFTY, or even Bitcoin.
The market moves in smaller swings, volume dries up, and everyone starts asking, “Is this breakout real?”
Let’s clear it up properly.
What Is The Elliott Wave Triangle Pattern?
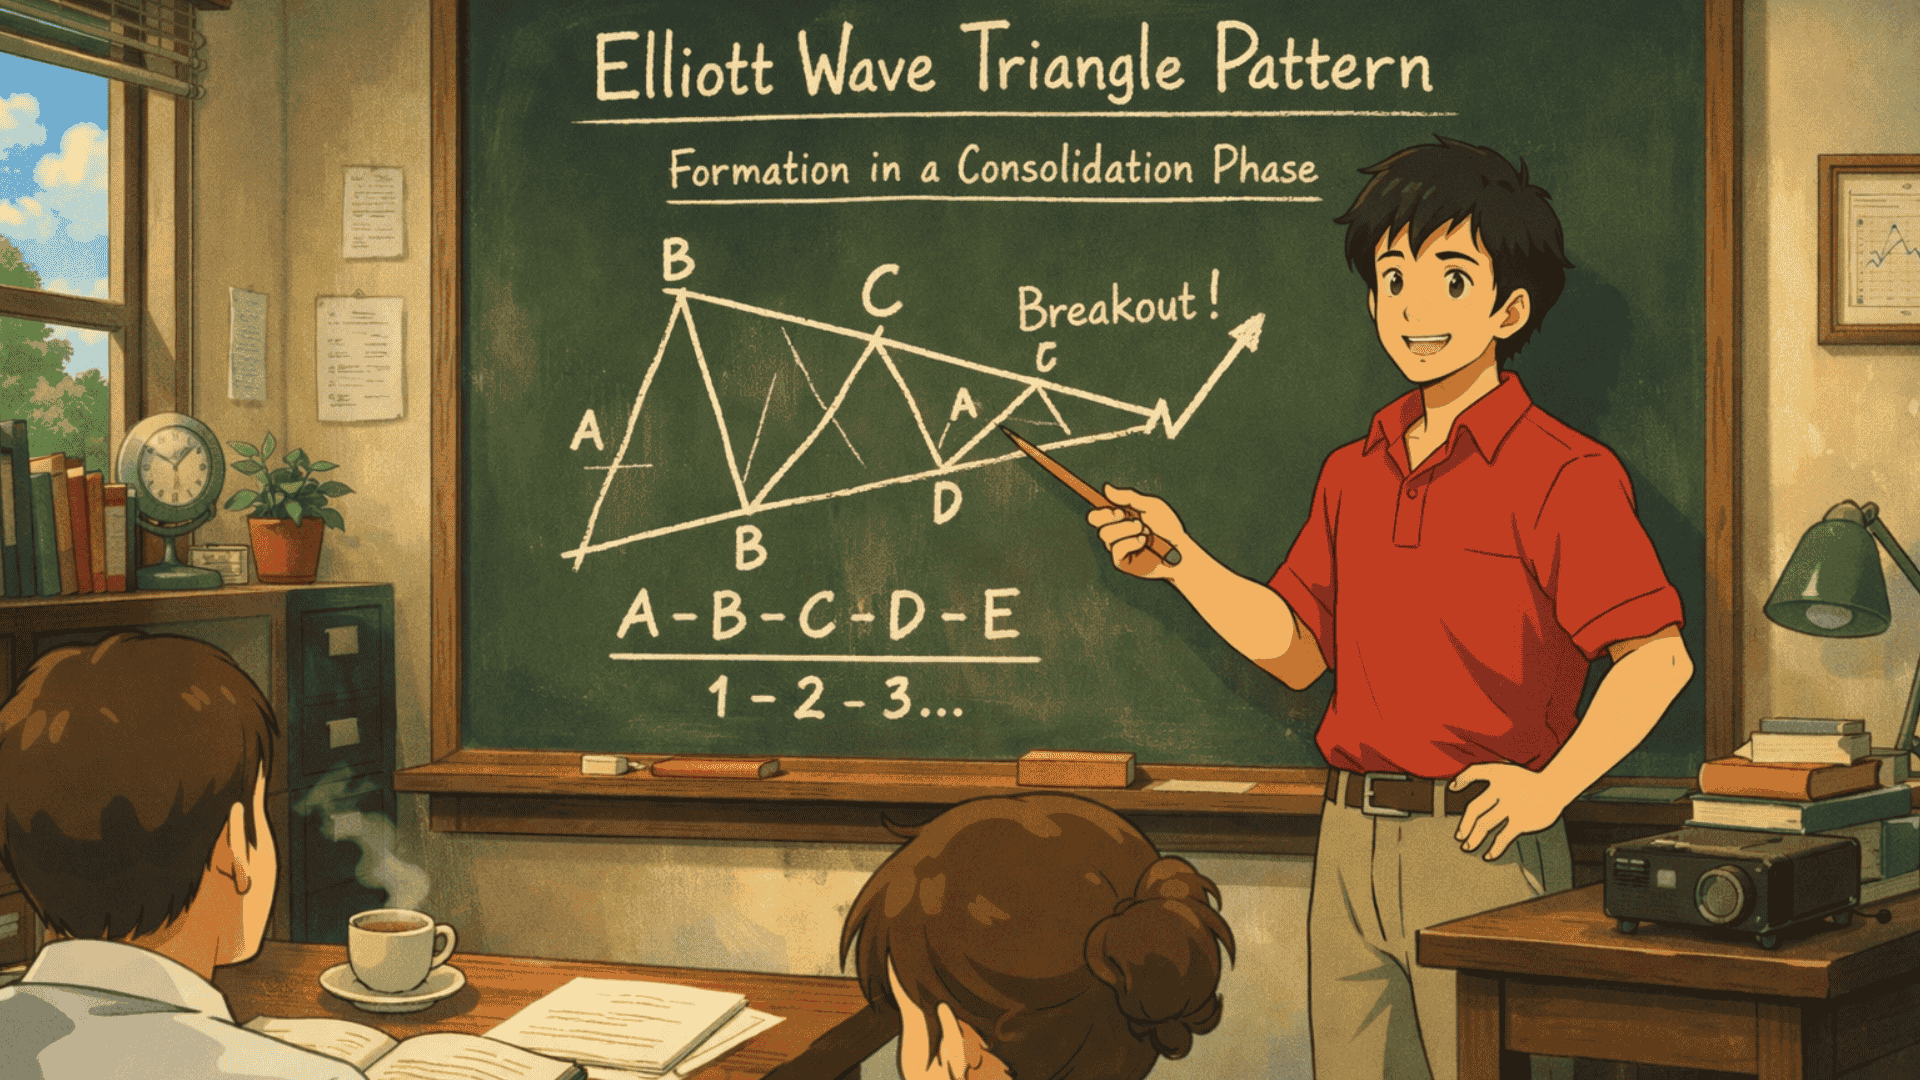
The Elliott wave triangle is a typical 5-wave pattern of the corrective pattern cycle, which is labeled A B C D E.
It tends to manifest during wave 4 of an impulse or B of a correction case. It is not a trend starter; it is a pause before the continuation of a larger motive wave Elliott pattern.
Price contracts between two trendlines, forming a triangle. Each leg subdivides into three waves, not five. That detail matters.
In simple terms:
- Five swings: A B C D E
- Each swing moves in three waves
- Occurs before the final thrust in the main trend
When wave E finishes, price typically breaks out sharply in the direction of the larger trend.
That breakout is what traders wait for.
Elliott Wave Triangle Rules
Let us explain clearly. The Elliott wave triangle rules are very strict. Provided that one of the rules is violated, then it is not a triangle.
Here are the core rules:
- It has five waves labeled A B C D E
- Each wave subdivides into corrective three-wave structures
- Wave C cannot move beyond the start of wave A in contracting triangles
- Wave D cannot exceed the end of wave B
- Wave E usually ends before touching the opposite trendline
The key principle?
Overlapping is allowed inside the triangle. That is normal.
But the triangle itself cannot appear in wave 2.
This distinguishes it from the start of a trend, where you might spot Elliott wave 1 as a leading diagonal.
What Is The Triangle Rule In Elliott Wave?
The triangle rule in Elliott Wave is simple: it forms only in wave 4, wave B, or occasionally in wave X within complex corrections.
It never forms in wave 1 or wave 3. If someone labels it there, something is wrong.
That rule alone saves traders from miscounting.
Types Of Elliott Wave Triangle Pattern
Not all triangles look the same. Structure changes slightly.
Here is a quick breakdown:
| Type | Description | Bias |
| Contracting Triangle | Trendlines converge | Most common |
| Running Triangle | B wave exceeds the start of A | Strong trend continuation |
| Barrier Triangle | One trendline flat | Sideways pressure |
| Expanding Triangle | Trendlines diverge | Volatile structure |
Now let’s talk about the one that confuses traders most.
Elliott Wave Expanding Triangle Pattern
The Elliott wave expanding triangle pattern is rare but powerful. Instead of narrowing, price swings get wider. Each wave is bigger than the previous one.
Volatility increases. Stops get hit on both sides.
This reflects emotional markets and often occurs during the complex stages of Elliott wave ABC correction rules.
Elliott Wave Expanding Triangle Rules
The Elliott wave expanding triangle rules include:
- Five waves labeled A B C D E
- Each wave subdivides into three waves
- Wave C exceeds wave A
- Wave D exceeds wave B
- Wave E exceeds wave C
In other words, each swing breaks the previous extreme.
This pattern reflects emotional markets. High news flow. High speculation. You see this in crypto during hype cycles.
But remember, once wave E completes, the breakout still follows the larger trend.
Elliott Wave Triangle Pattern Formula
There is no mathematical equation, but traders refer to the Elliott wave triangle pattern formula as structural guidelines:
- Position in trend matters
- Five corrective legs
- Decreasing volume in contracting triangles
- Breakout thrust equals the widest part of the triangle
That last point is practical.
The post-triangle move often travels roughly the distance of the widest part of the triangle. Traders use this for targets.
Once the breakout occurs, you can then project the potential Elliott wave 5 length to identify where the entire Elliot impulse wave pattern will finish.
For example:
- If the widest swing inside the triangle is 200 points.
- The breakout target may project near 200 points.
It is not magic. It is measured behavior.
How To Measure A Elliott Wave Triangle Pattern?
Before you jump to the next trade, there are three technical details you must get right. Most mistakes happen here.
1. Labeling Internal Waves Correctly
A valid triangle has five legs labeled A B C D E.
Each of those legs must form a 3-wave corrective structure. Not five. If any leg clearly breaks into a strong 5-wave impulse, the structure is likely miscounted.
This is where many traders go wrong. They see five swings and quickly label a triangle. But internal structure matters more than shape.
Clean three-wave subdivisions increase probability.
2. The Thrust Measurement Formula
Now, the practical part traders love.
The breakout, also called the thrust, often travels a distance equal to the widest part of the triangle base.
Here is how you measure it:
- Identify the largest vertical swing inside the triangle
- Measure that distance in points
- Project the same distance from the breakout level
For example, if the widest swing is 200 points, the post-breakout move can often travel near 200 points. It is not guaranteed, but it provides a logical target zone.
3. Timeframe Context Matters
Not all triangles carry equal weight.
Triangles forming on Daily or Weekly charts are far more reliable than patterns on a 1-minute chart. Lower timeframes often produce noise structures that fail quickly.
Higher timeframe triangles reflect broader market participation, stronger accumulation, and cleaner follow-through.
Serious traders always check the bigger chart first.
Real Trading Scenario: Wave 4 Triangle In NIFTY
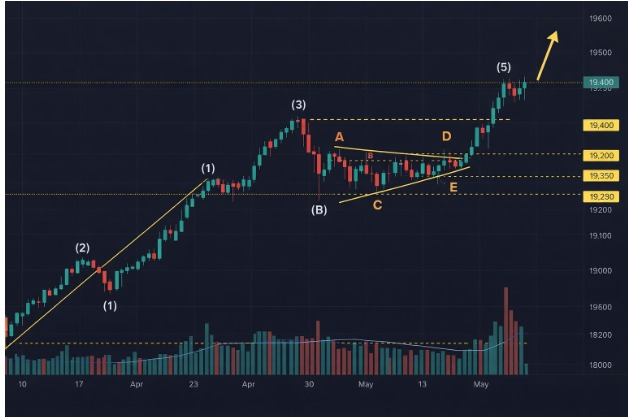
Let’s say NIFTY rallies from 18,000 to 19,500 in a clear five-wave impulse.
Then the price starts moving sideways:
- Drops to 19,200
- Rallies to 19,400
- Falls to 19,250
- Rises to 19,350
- Final dip to 19,280
Volume declines. Momentum weakens.
It is a normal Elliott wave 4 triangle.
As soon as wave E is accomplished around 19,280, the price breaks above 19,400.
Wave 5 begins.
Traders who recognized the triangle entry on breakout with stop below wave E. Risk is small. The reward is the wave 5 extension.
This is how experienced traders use it. Calmly. Systematically.
Risk Management Inside Triangle Patterns
Triangles test patience. False breakouts happen.
Here is how traders manage risk:
- Wait for wave E completion
- Enter only after a confirmed breakout
- Place a stop below wave E, low in the bullish case
- Avoid trading inside triangle noise
Many traders lose money trading inside the triangle. The real move comes after it ends.
Patience pays here.
Conclusion
The Elliott wave triangle pattern is precise. It appears at specific points in a trend. It follows clear rules. And it often leads to explosive continuation.
If you respect the structure and wait for confirmation, it becomes a powerful trading tool.
Rush it, and it becomes expensive. Markets reward patience. Triangles teach it.
FAQs
Q1: What Is The Triangle Rule In Elliott Wave?
Ans: Only in wave 4, wave B, or wave X may a triangle be formed. It cannot occur in wave 1 or wave 3.
Q2: What Is The Reliability of Elliott Wave Triangle Pattern?
Ans: It is reliable when correctly positioned in the trend and confirmed by a breakout. Mislabeling reduces accuracy.
Q3: How Do Traders Trade An Expanding Triangle?
Ans: Most wait for wave E completion and enter on the breakout. Expanding triangles are volatile, so stops must be wider.
Want to master the Elliott Wave Triangle Pattern with real chart examples and live market sessions?
Join our classes in stock market to build a professional trading foundation.
Before investing capital, invest your time in learning Stock Market.
Fill in the basic details below and a callback will be arranged for more information:


