



Every three months, listed companies publish a report card. Most beginners see a headline like “profit up 60%” and stop there. Knowing how to check quarterly results of a company changes that. So, instead of trusting headlines, you read a few numbers in a calm order.
If result season feels like a maze of numbers, you are not alone. Take it one step at a time, and the picture gets clearer.
Where to Find a Company’s Quarterly Results: Investor Website & Exchange Filings
First, let us locate the document. In fact, it takes only a minute once you know where to look.
Companies disclose their results every quarter through filings on the stock exchanges. Also, they post the same documents on their own website.
The easiest place to start is the investor-relations page of the company. Then look for sections named “financial results” or “quarterly results”.
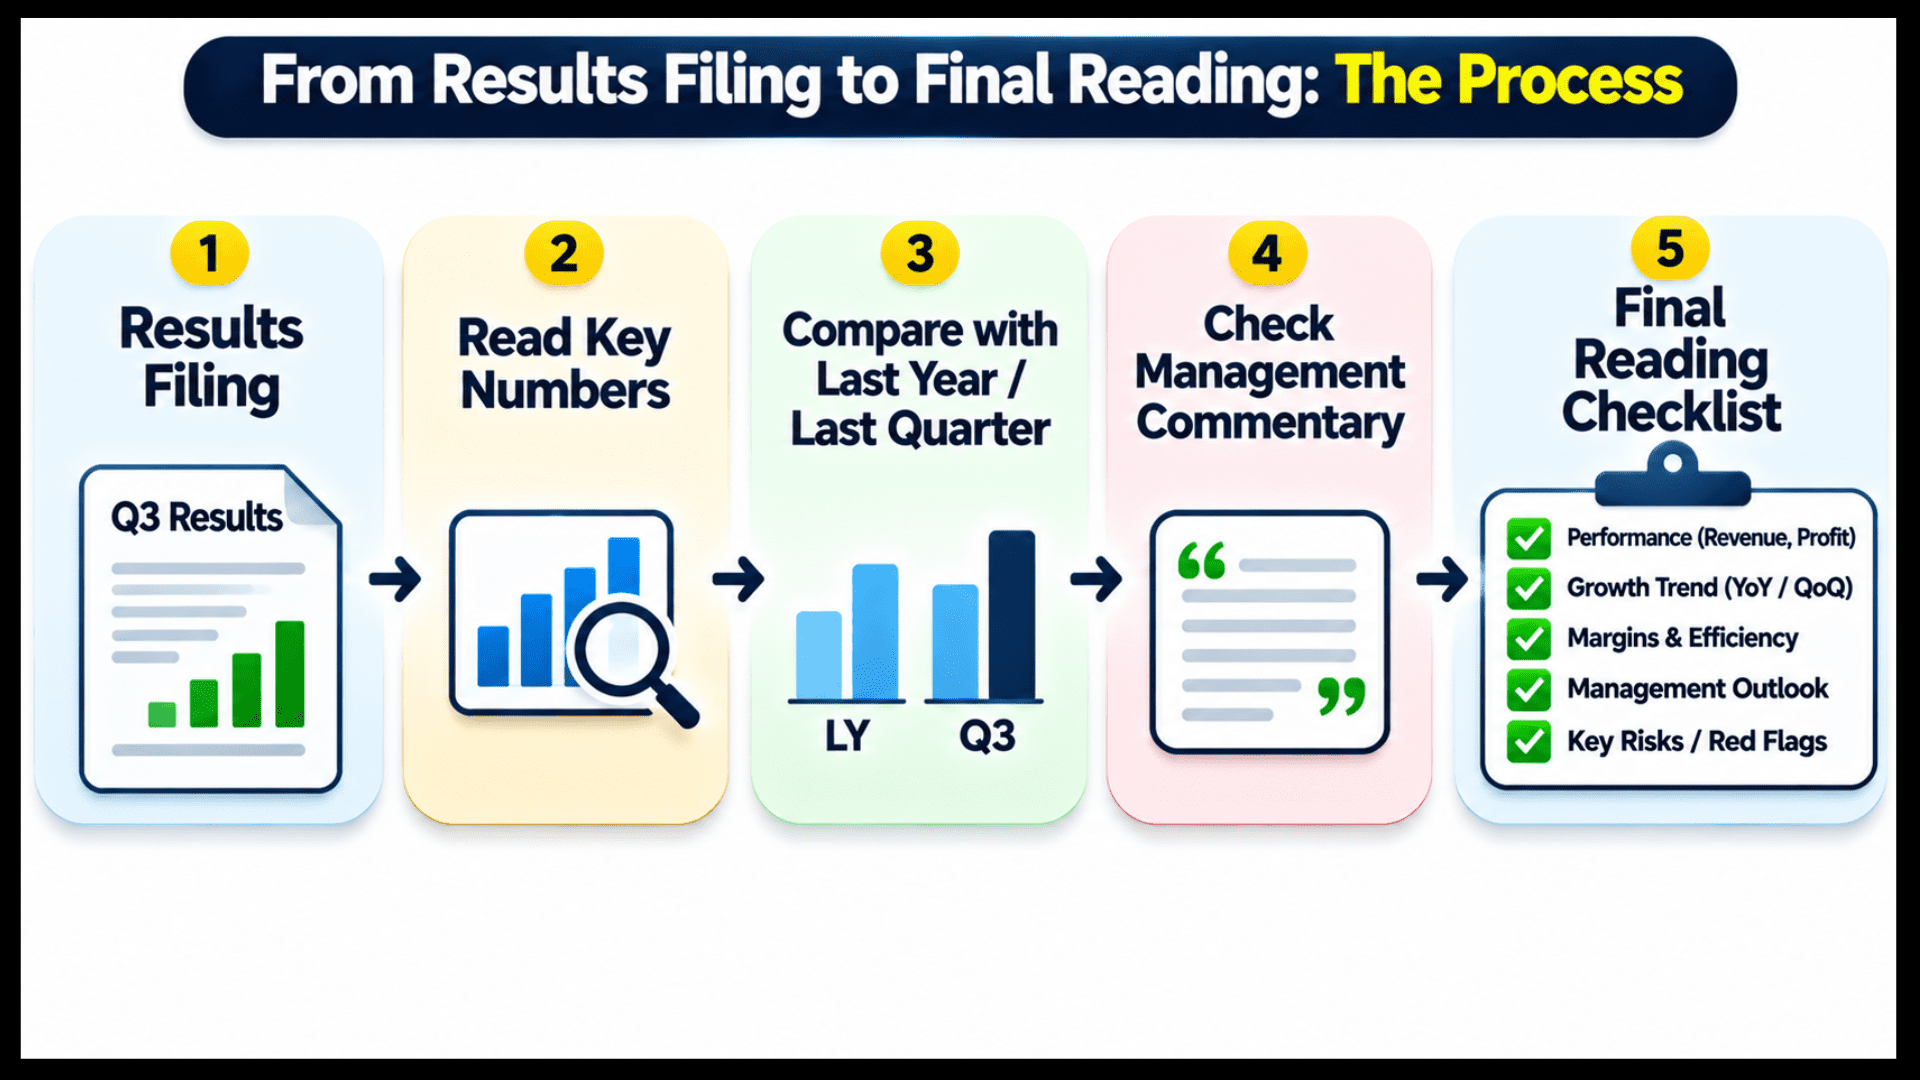
Next, you can search the company on the stock exchange website and open its announcements or filings section. Verify the format and the timelines there, since rules can change.
Besides, Indian companies usually follow an April to March financial year. So the quarter ending in June is Q1, September is Q2, December is Q3 and March is Q4.
What Does a Quarterly Results Statement Contain?
A results filing looks crowded at first. However, most of it is a simple profit and loss statement for the quarter.
First, the table below lists the lines you will see and what each one means.
| Line in the results | What it tells you |
|---|---|
| Revenue (sales) | How much the business sold in the quarter |
| Operating expenses | Cost of running the business, such as raw material, staff and rent |
| Operating profit (EBITDA) | Earnings from the core business before depreciation, interest and tax |
| Depreciation | Non-cash charge for wear of assets |
| Interest cost (finance cost) | What the company pays on its borrowings |
| Other income | Earnings outside the core business, which may be one-off |
| Profit before tax and tax | Profit left before and after the tax charge |
| Net profit and EPS | Final profit, and the profit per share |
Many filings show two versions: standalone and consolidated. Consolidated numbers include subsidiaries, so they give the bigger picture. Also, check which one you are reading.
If terms like EBITDA feel new, start with the basics of fundamental analysis first.
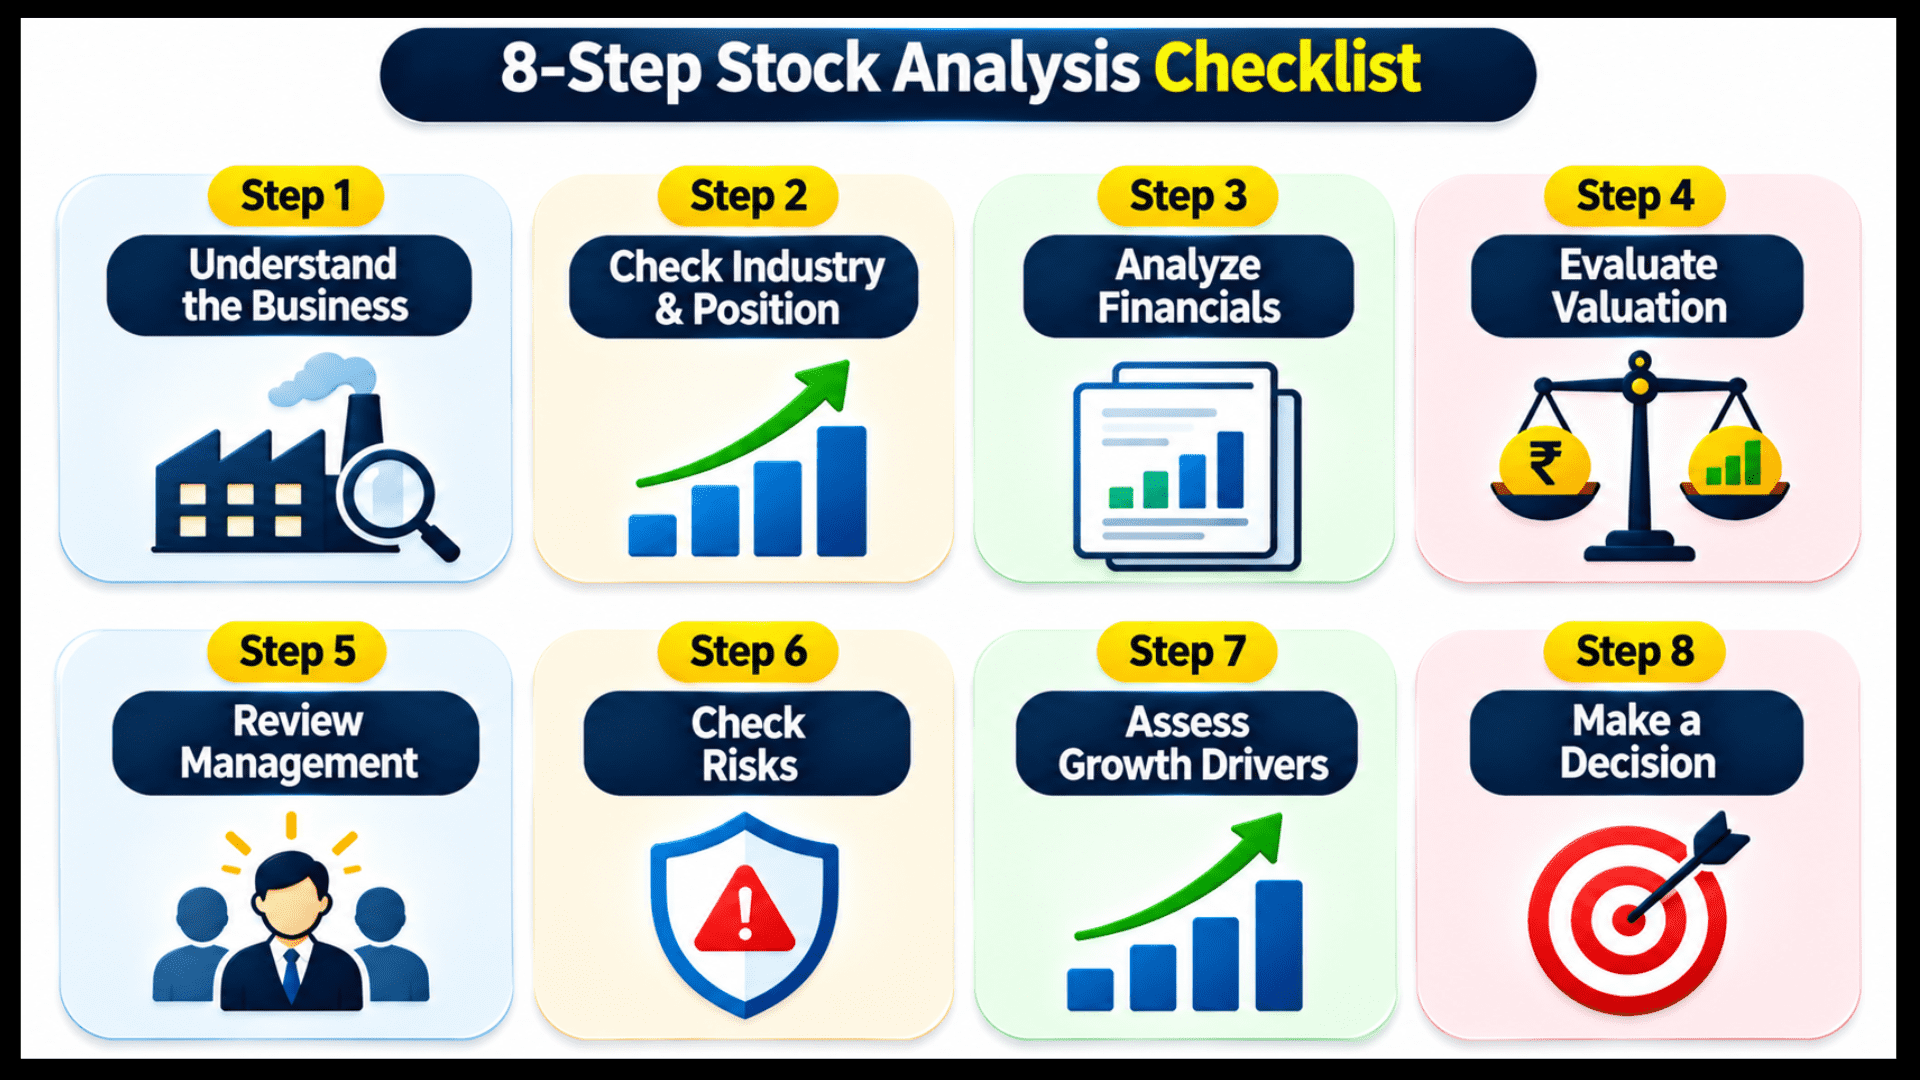
How to Check Quarterly Results of a Company: 8-Step Checklist
Next comes the part you will reuse every quarter. In short, the same order each time keeps you from getting lost in the filing.
- Revenue: Is the company selling more than before? Growth in sales is the base for everything else.
- Operating profit and margin: Divide operating profit by revenue. A rising margin means costs are under control.
- Net profit: This is the final profit after all costs and tax. Check how it moved against earlier periods.
- EPS: Net profit divided by the number of shares. If new shares were issued, profit can grow while EPS does not.
- YoY and QoQ: Compare with the same quarter last year and with the previous quarter. More on this below.
- One-off items: Check whether other income or an exceptional item pushed profit up or down.
- Debt and interest: See if the interest cost is rising and how comfortably operating profit covers it.
- Cash flow note: Compare profit with the cash actually earned by the business.
Also, do not rush through the list. Instead, write each answer in one line in a notebook or sheet.
YoY vs QoQ in Quarterly Results: Which Comparison Should You Use?
Two short terms confuse most beginners. So, let us settle them before the example.
YoY (year on year) compares a quarter with the same quarter one year ago. QoQ (quarter on quarter) compares it with the quarter just before.
First, YoY removes seasonal effects. For example, a retail business may always sell more in the festive quarter.
Meanwhile, QoQ shows the latest direction of momentum. It is useful, but it can mislead when the business is seasonal.
In short, a simple habit works well. Use YoY as the main lens and QoQ as a cross-check.
Quarterly Results Analysis With Example
Now let us put the checklist to work. In fact, an example makes every term easier to remember.
Let us read a hypothetical Company A. All numbers are for illustration only and are in Rs crore, except EPS.
The table shows the same quarter last year, the previous quarter and the latest quarter. Tax is assumed at 25% and the share count at 50 crore.
| Line item (Rs crore) | Same quarter last year | Previous quarter | Latest quarter | YoY change | QoQ change |
|---|---|---|---|---|---|
| Revenue (sales) | 1,100.0 | 1,180.0 | 1,250.0 | +13.6% | +5.9% |
| Operating expenses | 900.0 | 950.0 | 1,000.0 | – | – |
| Operating profit | 200.0 | 230.0 | 250.0 | +25.0% | +8.7% |
| Operating margin (%) | 18.2 | 19.5 | 20.0 | +1.8 pts | +0.5 pts |
| Depreciation | 55.0 | 58.0 | 60.0 | – | – |
| Interest cost | 45.0 | 38.0 | 40.0 | – | – |
| Other income | 12.0 | 10.0 | 30.0 | – | – |
| Profit before tax | 112.0 | 144.0 | 180.0 | – | – |
| Tax at 25% (assumed) | 28.0 | 36.0 | 45.0 | – | – |
| Net profit | 84.0 | 108.0 | 135.0 | +60.7% | +25.0% |
| EPS (Rs, 50 crore shares) | 1.68 | 2.16 | 2.70 | +60.7% | +25.0% |
Next, here is how the checklist reads for Company A:
- Revenue grew 13.6% YoY and 5.9% QoQ.
- Operating profit grew 25.0% YoY, and the margin moved from 18.2% to 20.0%.
- Net profit rose 60.7% YoY to Rs 135.0 crore, and EPS is Rs 2.70.
Notice that net profit grew much faster than revenue. That looks wonderful, but one number needs a second look.
Finally, formulas used: operating profit = revenue – operating expenses. EPS = net profit / 50 crore shares.
Net profit = (operating profit – depreciation – interest + other income) x (1 – 25%).
How to Spot One-Off Items in Quarterly Results
Headline profit can hide a lot. So, always ask what drove the jump.
In the example, other income jumped to Rs 30 crore from Rs 10 crore in the previous quarter. Suppose Rs 20 crore of it came from a one-time gain.
However, remove that gain and the story changes. Net profit becomes about Rs 120.0 crore and EPS about Rs 2.40.
Even then, profit is up 42.9% YoY. It is still strong, but it is a smaller jump than the headline 60.7%.
Besides, always read the notes to the results. They explain exceptional items, tax changes and any change in accounting.
Check Debt, Interest Cover and Cash Flow in Quarterly Results
Profit tells only half the story. Likewise, a company can show profit and still struggle to pay its lenders.
First, use interest cover, which is operating profit divided by interest cost. Company A’s cover is 6.25x now, against 4.44x a year ago, so the burden has eased.
Next, compare profit with cash. Cash flow statements are often published with half-yearly and annual results, so check the format for your company.
Suppose Company A’s half-year operating cash flow is Rs 170 crore against a half-year net profit of Rs 243 crore. That is about 70.0% of profit turning into cash.
A ratio that stays far below 100% for several periods deserves questions. To go deeper, read about how free cash flow is calculated and why it differs from profit.
Compare Quarterly Results With Peers and Past Quarters
One company’s numbers mean little alone. So, compare them with its own past quarters and with a similar company in the same sector.
Then look at the trend over at least four to eight quarters. Still, a single good quarter can be luck, while a steady pattern is more reliable.
The table compares hypothetical Company A with Company B, a peer of similar size.
| Check (latest quarter vs same quarter last year) | Company A | Company B |
|---|---|---|
| Revenue growth (YoY) | 13.6% | 11.1% |
| Operating margin | 20.0% (last year 18.2%) | 13.0% (last year 13.9%) |
| Net profit growth (YoY) | 60.7% | -12.5% |
| Net profit growth excluding one-off | 42.9% | -12.5% |
| Interest cover (operating profit / interest) | 6.25x | 2.50x |
Company B’s sales grew, but its margin slipped and its interest cover is thin. As a result, Company A looks healthier on these checks.
Growth should also be seen against how the market prices it. A look at what the PEG ratio means shows how growth and valuation can be viewed together.
However, be careful when comparing across sectors. A bank, an IT firm and a factory have very different cost structures, so margins are not comparable.
Red Flags in Quarterly Results to Watch For
Some patterns should make you slow down and read more. Still, they do not prove anything on their own.
- Profit rising while cash flow keeps falling for several quarters.
- Growth driven mainly by other income or one-off gains.
- Interest cost rising faster than operating profit.
- A margin that shrinks quarter after quarter despite higher sales.
- Sudden changes in tax, accounting policy or the auditor’s remarks.
- Big gaps between standalone and consolidated numbers without explanation.
Meanwhile, if you notice two or three of these together, read the notes and the management commentary in full.
What Quarterly Results of a Company Cannot Tell You?
First, results describe the past three months. They do not predict the next quarter, and they do not say whether a stock is cheap or expensive.
Many readers also wonder how the market reacts on result day. This page does not cover that, but you can read about how results can move a share price separately.
In fact, good results can be priced in already, and weak results can be ignored. That is why reading the numbers and judging the price are two different skills.
To judge price, you need a method. Ways to value a stock explains the common ones in simple steps.
How to Build a Habit of Quarterly Results Analysis Every Quarter?
Reading results gets faster with practice. So, pick two companies and run the checklist for the last four quarters.
Also, keep a simple sheet with revenue, margin, net profit, EPS and interest cover. Update it every quarter.
Likewise, a mentor review at this stage helps, because someone else spots what you skipped. In our live classes, learners bring their own sheets and get feedback.
Besides, reading a few good books on fundamental analysis will also build your vocabulary.
Do you also open a results filing and still wonder what the numbers really say? Reading about results is easy, but practice on real filings and a mentor’s feedback build confidence.
Join our live classes from your mobile, ask your doubts and learn step by step.
Conclusion
To check quarterly results, find the filing, follow the eight steps, and compare YoY and QoQ. Then watch for one-offs, debt and cash flow.
In short, do it the same way every quarter. As a result, you spot patterns faster and trust headlines less.
Finally, the habit matters more than any single number. Remember, this is learning, not a buy or sell signal.
Disclaimer: This page is for education only and is not investment advice. All numbers for Company A and Company B are hypothetical and for illustration only.
Finally, verify filings and timelines on official sources before you act.
Frequently Asked Questions
Before investing capital, invest your time in learning Stock Market.
Fill in the basic details below and a callback will be arranged for more information: