



The meaning of free cash flow is easy once you picture a shop. Free cash flow is the cash left after the business has paid to run and maintain itself.
Here, this page explains the definition, the formula and a worked example in plain English.
Free Cash Flow Meaning in Simple Words
Free cash flow (FCF) is the cash a company generates from its business. Simply, it is what remains after it spends on the assets it needs to keep running and growing.
Beginners who want to learn value investing often begin with exactly this idea.
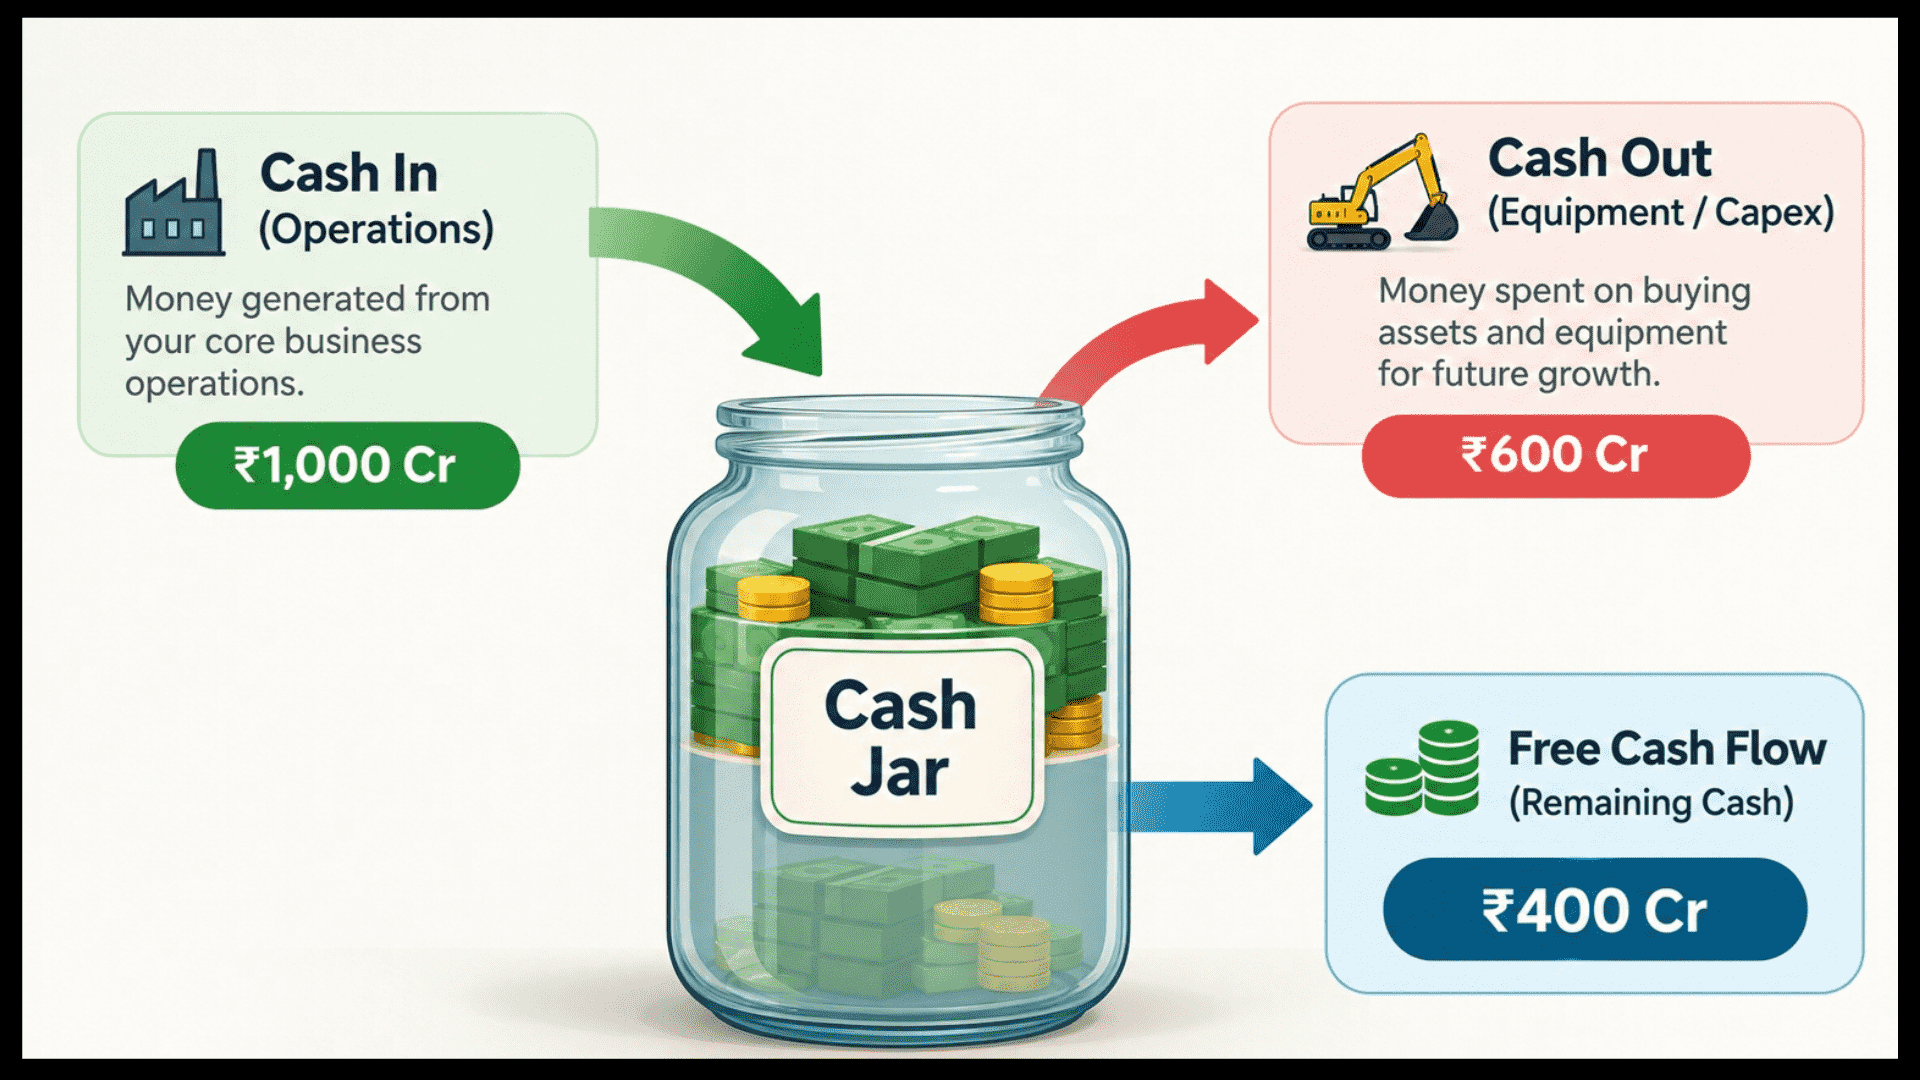
Free Cash Flow Example With a Tailor
For example, think of a tailor. After the month’s sales are collected and the bills paid, some money goes into a new sewing machine.
So, what remains is the tailor’s free cash. That leftover cash can pay off debt, pay dividends, buy back shares or fund growth.
Thus, this is why investors watch it closely.
What Is Free Cash Flow?
The free cash flow formula has two parts, both taken from a company’s reports.
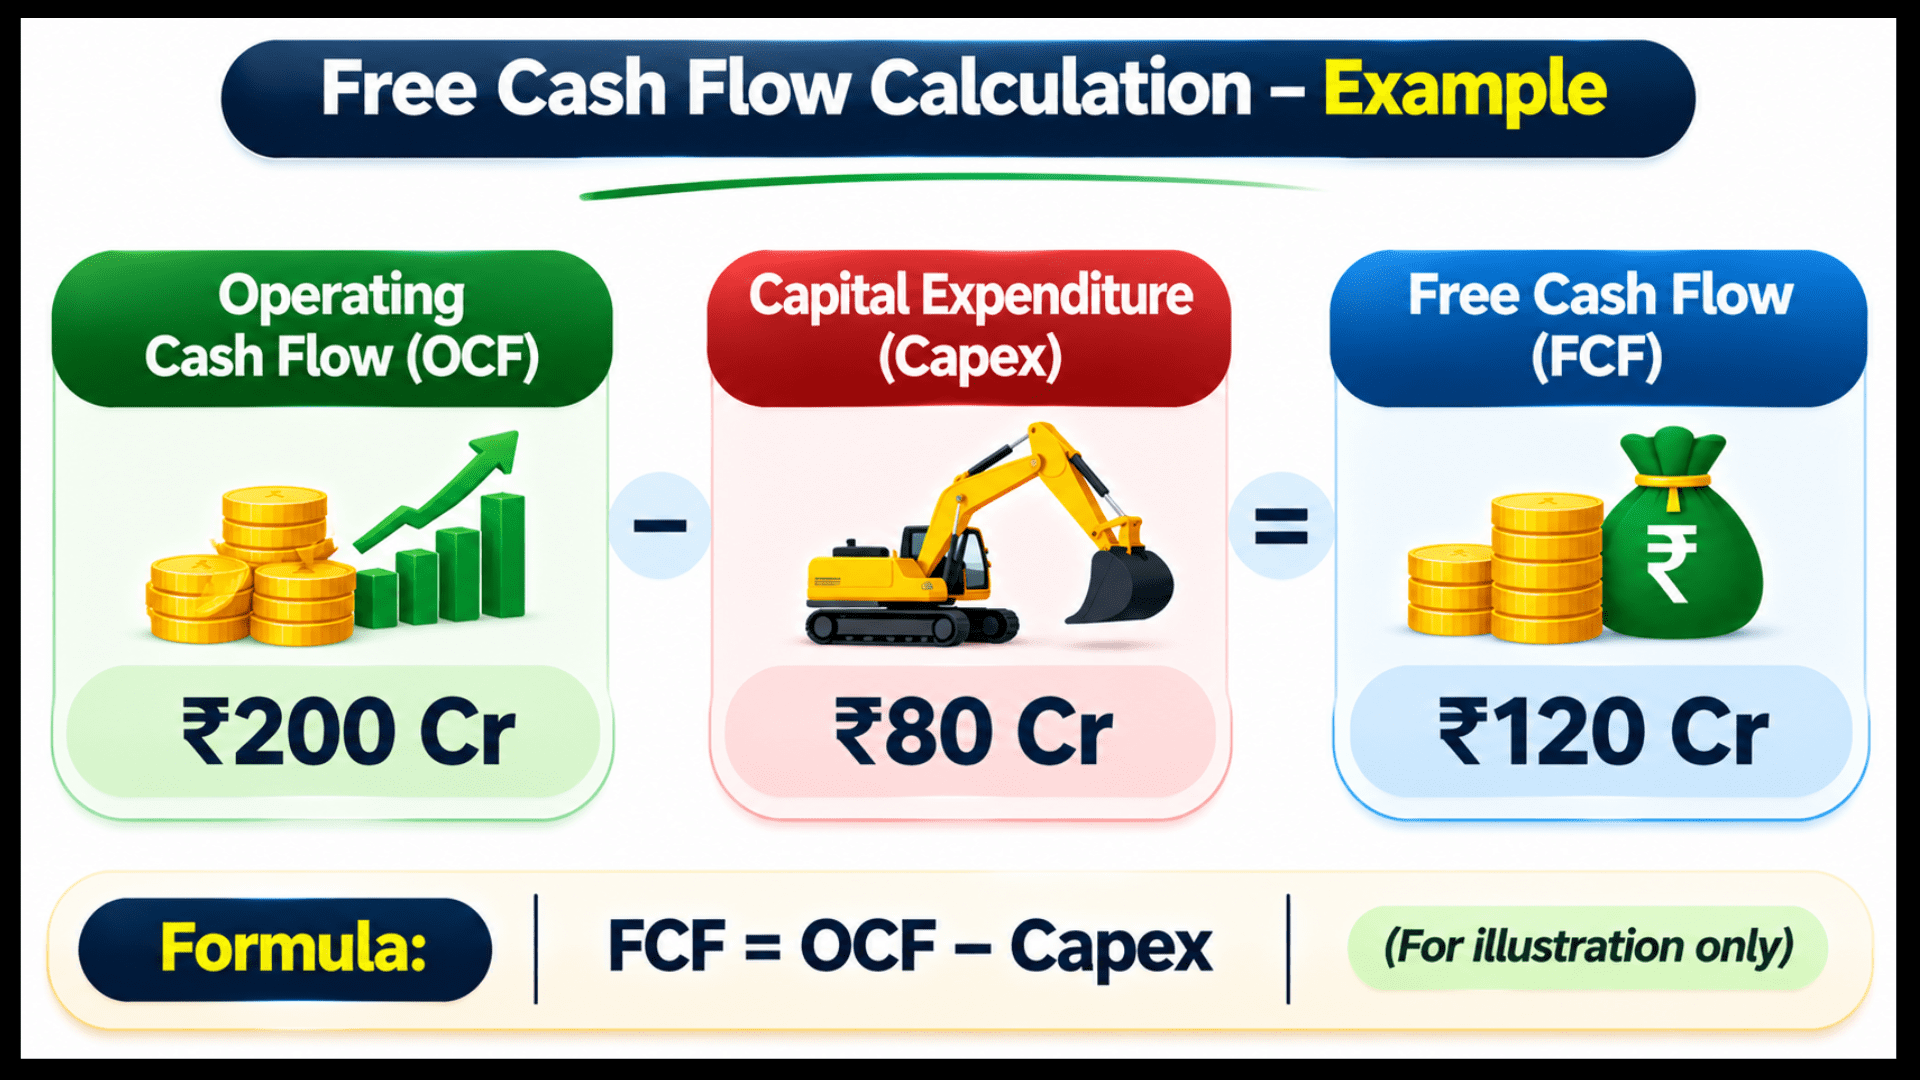
Free cash flow = Operating cash flow – Capital expenditure
Operating cash flow (OCF) is the cash the core business brings in, as shown in the cash flow statement. In addition, capital expenditure (capex) is the cash spent on buying or upgrading fixed assets. Examples are machines, buildings and equipment.
This same number feeds valuation methods such as DCF. How to Find Valuation of a Stock explains how.
Why Free Cash Flow Matters to Investors?
Profit tells you what a company earned on paper. In contrast, free cash flow tells you what it could actually put in the bank after investing in itself.
First, a business that keeps generating free cash has options. It can survive a slow year, repay loans or reward shareholders without borrowing more.
However, a business that never generates free cash may depend on loans or new share issues to keep going. That is a useful thing to know early.
Also, growth and value investors read this cash differently, as value investing vs growth investing explains.
How to Calculate Free Cash Flow Step by Step
Calculating FCF is easier than it sounds, because you only need two numbers from one report. Let us use a hypothetical Company A, for illustration only.
- Open the cash flow statement and note the operating cash flow. Say it is 200.
- Find the cash spent on fixed assets (capex). Say it is 80.
- Then, subtract capex from operating cash flow: 200 – 80 = 120.
- Read the result as free cash flow of 120 for that year.
Free Cash Flow Margin: How Much Operating Cash Survives Capex?
You can also divide FCF by operating cash flow. This shows how much operating cash survives capex: 120 / 200 x 100 = 60%.
However, operating cash flow alone ignores what the business must spend to stay alive. The gap between the two is covered in free cash flow vs operating cash flow.
Tip: use the same unit and the same period for both numbers. Mixing a quarter with a full year gives a wrong answer.
Where to Find Operating Cash Flow and Capex in a Company Report
First, both numbers sit in the annual report. Operating cash flow is usually the first total in the cash flow statement, under the heading for operating activities.
Next, capex usually appears under investing activities, often as “purchase of property, plant and equipment” or similar wording. Labels differ between companies, so read the line items carefully.
Besides, reading a full report becomes much easier once the basics are clear. A step-by-step path is laid out in how to learn fundamental analysis.
| Item | Where it usually sits | What to look for |
|---|---|---|
| Operating cash flow | Cash flow statement, operating activities | Total cash from operations |
| Capex | Cash flow statement, investing activities | Purchase of fixed assets, including upgrades |
| Free cash flow | Not always shown, you calculate it | OCF minus capex |
The table above shows where each input is usually found. Wording varies, so confirm in the company’s own notes.
Free Cash Flow Example: Company A Over Three Years
Now let us apply the formula to three years of hypothetical figures (amounts in crore, for illustration only). FCF = OCF – capex, and FCF margin = FCF / OCF x 100.
| Year | Operating cash flow | Capex | Free cash flow | FCF as % of OCF |
|---|---|---|---|---|
| Year 1 | 120 | 45 | 75 | 62.5% |
| Year 2 | 150 | 60 | 90 | 60.0% |
| Year 3 | 135 | 90 | 45 | 33.3% |
Overall, the three years add up to a free cash flow of 210 crore.
Notice the story. Year 2 looks healthy. However, in Year 3 operating cash flow fell while capex jumped, so free cash flow dropped to 45.
That does not say the company is good or bad. Instead, it only tells you to ask why capex rose and whether operating cash flow will recover.
To see how the two cash figures differ, read Free Cash Flow vs Operating Cash Flow.
It shows why a company can look strong on one and weak on the other.
Studying more than one framework helps here, and good reading lists are collected in books on fundamental analysis.
ADD IMAGE: Line chart of Company A’s operating cash flow, capex and free cash flow over three years (for illustration only).
How to Read the Free Cash Flow Example
Here is a simple way to read any three-year FCF table:
- Is operating cash flow rising, flat or falling?
- Is capex growing faster than operating cash flow?
- Is the business adding new capacity, or only maintaining old assets?
- Does free cash flow stay positive across most years?
In fact, answers to these questions matter more than a single number. Two companies with the same FCF can be in very different positions.
To see how returns are built on top of this cash, DuPont analysis is a helpful next step.
What Is Free Cash Flow Used For?
Free cash flow is the pool a company can draw on without hurting its existing business. The table shows the common uses.
| Use of free cash flow | What it means |
|---|---|
| Repay debt | Lower borrowing and interest burden |
| Pay dividends | Share part of the cash with shareholders |
| Buy back shares | Return cash by reducing shares in the market |
| Fund growth | Open new plants, stores or products |
| Build a cash cushion | Prepare for weak years |
Similarly, investors who follow a quality-first approach often look at cash generation closely. It fits naturally with the thinking behind value investing.
Common Mistakes When Using Free Cash Flow
Almost every beginner slips in a few predictable ways. So, knowing them early saves a lot of confusion.
- Using one year only. A single year can be unusually good or bad.
- Ignoring the business type. Some businesses need heavy machinery, others need very little.
- Treating high FCF as safe. A one-time asset sale or delayed payment can inflate cash for a year.
- Comparing across industries. Capex needs differ widely between sectors.
- Forgetting debt. Free cash flow means little if most of it goes to interest. The impact of interest rate on the stock market shows why rates matter.
Is Free Cash Flow the Same as Net Profit?
Net profit is an accounting figure. Also, it includes non-cash items like depreciation, while FCF follows actual cash movement.
In fact, a company can show a profit and still have little free cash. The full comparison is in is free cash flow same as profit.
Can Free Cash Flow Be Negative?
Yes, it can. Negative FCF simply means capex was larger than operating cash flow in that period.
However, it is not automatically bad. For instance, a growing business may spend heavily today, which is different from a business whose operations are weak.
Besides, the causes are explained in what it means when free cash flow is negative.
Limits of Free Cash Flow to Keep in Mind
Definitions vary slightly. For example, some analysts adjust for interest or lease payments. As a result, two sources may show different FCF.
One year is a thin sample. Therefore, look at several years, because capex can be lumpy. A single quarter can mislead, as discussed in how quarterly results affect share price.
Free cash flow is one input, not a buy or sell signal. Finally, having a mentor review a real annual report with you can help you see what the numbers hide.
Do you also see an FCF number and wonder whether it is good or bad?
Reading about FCF is easy, but real annual reports and a mentor’s answers teach you to judge it.
Join our live classes from your mobile, ask your doubts and learn step by step.
Conclusion
So, free cash flow is operating cash flow minus capex. It shows the cash left after a business pays to maintain and grow its assets.
In short, calculate it from the cash flow statement and read it over several years. As a result, you can see what the profit figure alone hides.
Always ask why it moved, because the reason behind the number matters more than the number itself. Remember, this is learning, not a buy or sell signal.
Disclaimer: All numbers here are hypothetical and for illustration only. This is education, not investment advice.
Fundamentals are one input, estimates can be wrong, and past results do not guarantee future results.
Frequently Asked Questions
Before investing capital, invest your time in learning Stock Market.
Fill in the basic details below and a callback will be arranged for more information: