

Markets do not tend to follow straight lines. They rush, stop, make corrections, and rush. That is precisely the rhythm that the Elliott Wave Theory attempts to describe.
Developed by Ralph Nelson Elliott, this concept explains how market psychology creates repeating wave patterns.
If you trade stocks, crypto, or forex, learning how to draw Elliott Wave can help you spot trends earlier and understand where the price may go next. It is not magic. It is simply a structured observation of crowd behavior on charts.
This guide shows how to draw Elliott Wave step by step, using fair logic, examples on the actual charts, and tools that the traders themselves use.
Understanding The Elliott Wave Structure Before Drawing
Before drawing anything on a chart, you need to understand how the Elliott wave pattern is structured.
Markets move through two fundamental phases:
| Wave Phase | Direction | Structure |
| Impulse Waves | With the trend | 5 waves |
| Corrective Waves | Against the trend | 3 waves |
The basic pattern looks like this:
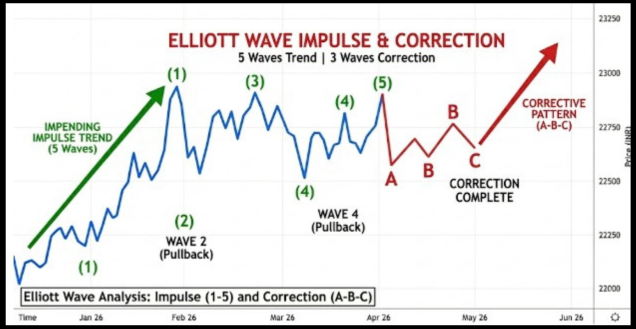
- Waves 1, 3, and 5 travel in the direction of the trend.
- Waves 2 and 4 are pullbacks.
- The correction of waves (A, B, C) comes after the fifth wave.
Think of it as mountain climbing: you move forward, pause, take a few steps back, then push on again.
That rhythm is what creates the wave pattern traders follow.
How To Draw Elliott Wave Step By Step?
There is no guessing in how to draw waves. It takes certain guidelines and follows price fluctuations.
Traders analyze the tendency of prices to move between highs and lows, and label them as per the five impulse waves and three corrective waves of the Elliott Wave pattern.
Step 1: Identify The Market Trend
The initial step will be to spot the general direction in the graph.
Look at the most recent setup in the prices and observe whether the market is headed upwards, downwards, or flat.
This will be the first step to the right location of the onset of Wave 1 and the manner in which the entire Elliott wave formation will unfold.
Ask a simple question:
- Is the market developing high highs and low lows?
- Or lower highs and lower lows?
Example scenario:
| Asset | Timeframe | Observation |
| Bitcoin | 4H chart | Series of higher highs |
| Nifty 50 | Daily chart | Uptrend forming |
In the case of the upward movement, the impulse movement will shift upward. Under a declining trend, the impulse wave will fall.
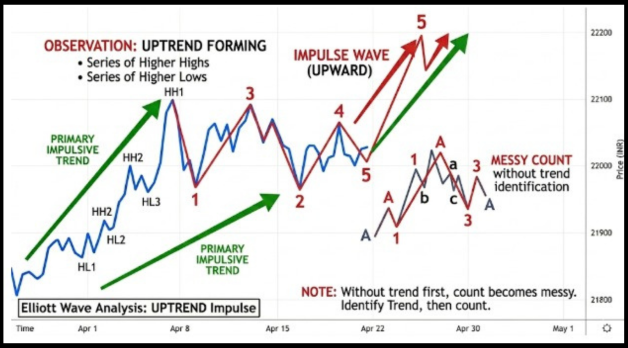
There is no counting of waves without determining the trend first.
Step 2: Mark Wave 1
The first significant change of trend or a consolidation is known as Wave 1.
It is typically triggered by early buyers when the product is making its way back up into the market following a lengthy duration of sideways action or downward trend in price.
This is the point at which the majority of the traders remain skeptical of the move.
And this is why Wave 1 usually builds up gradually until the new trend is felt by the wider market.
Characteristics:
- Often ignored by the crowd.
- Volume slowly increases.
- News usually appears later.
Example:
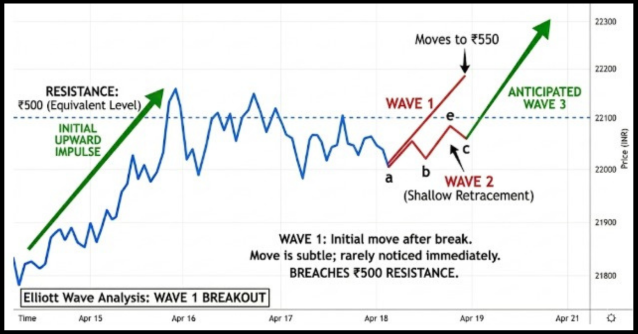
A stock breaks a resistance at ₹500 and moves to ₹550. That move can be Wave 1.
It is usually subtle. Traders rarely notice it immediately.
Step 3: Identify Wave 2 Correction
Wave 2 is a first move pullback. It is a transitional stage during which early traders make profits and doubtful traders engage in shorting.
Even though the price drops, above the beginning of Wave 1, the price still keeps the emergent trend intact.
Important rule:
- Wave 2 cannot go below the start of Wave 1.
Typical behavior:
| Feature | Description |
| Retracement | retraces 38.2% to 78.6% of Wave 1, with 50% and 61.8% being the most common Fibonacci levels. |
| Sentiment | The market thinks the trend failed |
| Volume | Lower than Wave 1 |
Example:
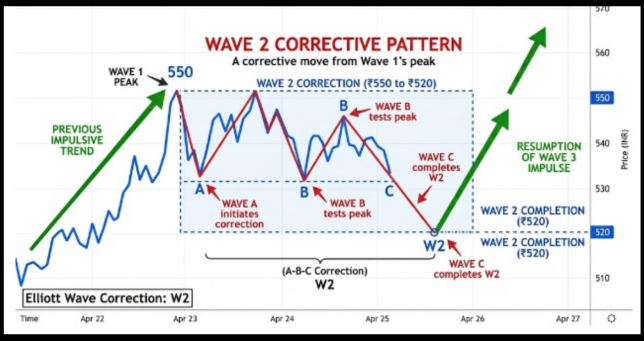
Stock moves from ₹550 down to ₹520. That becomes Wave 2.
Step 4: Draw Wave 3 The Strongest Move
Wave 3 is the most powerful part of the pattern. Traders love this wave because it often contains the largest price movement.
Rules:
- Wave 3 can never be the shortest among waves 1, 3, and 5
- Usually extends beyond Wave 1 significantly
Typical characteristics:
- Strong momentum
- Rising volume
- News headlines appear
- Retail traders start entering
Example:
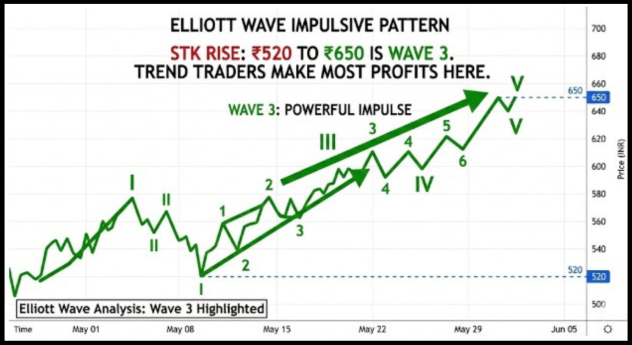
Stock rises from ₹520 to ₹650. That is clearly Wave 3.
This wave is where trend traders make most profits.
Step 5: Mark Wave 4 Pullback
Wave 4 is another correction. It tends to follow the powerful wave three impulse. It usually moves sideways or slightly backward as the market digests gains before the final push upward.
Key rule: Waveform must not overlap with the wave one price territory in a standard impulse wave. If Wave 4 moves into Wave 1’s range, the count is invalid.
Rule of Alternation: If Wave 2 is a sharp zigzag correction, Wave 4 will typically be a sideways flat or triangle correction, and vice versa. This alternation helps traders anticipate the character of the next corrective wave.
Exception: diagonal triangle patterns are the only formation where Wave 4 is allowed to overlap Wave 1.
Typical retracement:
| Wave | Typical Retracement |
| Wave 2 | 38.2% to 78.6% |
| Wave 4 | 23.6% to 38.2% |
Example:

Price falls from ₹650 to ₹620. That becomes Wave 4.
This pause shakes out impatient traders before the final move.
Step 6: Draw Wave 5 The Final Push
Wave 5 is the last impulse move. It usually occurs when market excitement peaks.
Unlike Wave 3, where traders enter on momentum, Wave 5 participation is largely driven by FOMO as the trend nears exhaustion.
Common signals:
- Strong retail participation
- Media coverage
- Momentum indicators start diverging
Example:
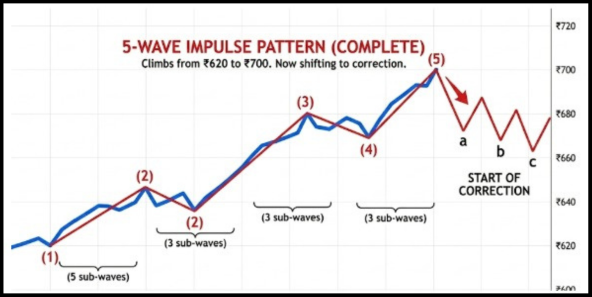
Price climbs from ₹620 to ₹700. That completes the 5-wave impulse structure.
After this, the market typically shifts into a correction.
This stage is often where traders start watching for an Elliott wave reversal pattern as the trend approaches exhaustion.
How To Draw Elliott Wave Patterns For Corrections?
After the five-wave impulse, a three-wave correction follows. This is labeled A, B, and C.
These corrective waves usually move against the main trend and help the market cool off before the next potential trend cycle begins.
| Wave | Direction | Behavior |
| Wave A | Against trend | First drop |
| Wave B | Temporary recovery | False hope |
| Wave C | Final correction | Strong decline |
Example scenario:
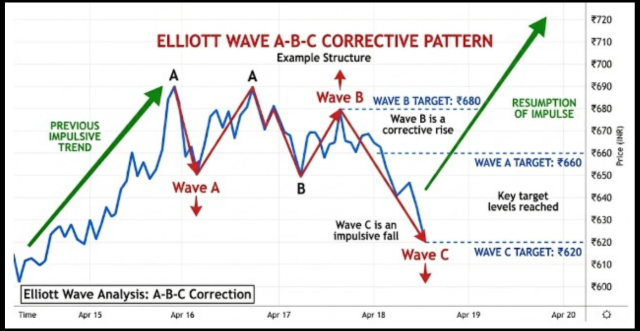
- Wave A: Price drops from ₹700 to ₹660
- Wave B: Price rises to ₹680
- Wave C: Price falls to ₹620
After this correction, the cycle may restart.
Note: This is a zigzag correction. Flats and triangles that follow different internal structures are covered in the next section.
How To Draw Elliott Wave On TradingView?
Many traders prefer using TradingView because it includes built-in wave drawing tools that make it easy to read Elliott wave structures on live charts.
By using these automated tools, you can ensure your labels stay proportional to the price action.
Steps To Draw Waves On TradingView:
- Open the chart of your asset
- Select the Elliott Wave tool from the left toolbar
- Click on the chart to mark Wave 1
- Continue marking waves 2, 3, 4, and 5
- Add A, B, and C correction waves
Helpful tip: Use higher timeframes first.
| Timeframe | Purpose |
| Daily | Identify a major trend |
| 4H | Draw main waves |
| 1H | Refine entries |
Many traders combine Elliott Wave with Fibonacci retracement tools to validate corrections.
Types Of Elliott Wave Patterns You Should Know
In addition to the more famous impulse waves and simple corrective patterns, such as a zigzag mentioned previously, the Elliott Wave theory comprises some additional patterns that are quite common in the actual markets.
The patterns assist traders in knowing the stages of consolidation, exhaustion of patterns, and long-term momentum.
They can easily be identified at an early age, thereby making a lot of difference in timing entries and exits.
1. Extended Waves
In Elliott Wave analysis, the impulse waves are prone to being much longer than the rest. This is referred to as an extended wave.
In every impulse wave, exactly one of Wave 1, Wave 3, or Wave 5 will always extend, with Wave 3 being the most common, typically occurring when the market is on a strong run and momentum is building.
For traders, strong waves may be an indicator of strong trends due to strong purchase or sale pressure.
Chart example:
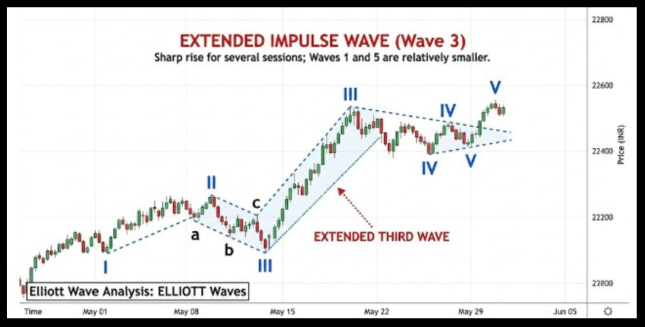
Look at the above five-wave bullish structure, where Wave 3 rises sharply for several sessions while Waves 1 and 5 remain relatively smaller.
This longer third wave represents the extended impulse.
2. Diagonal Triangles (Leading And Ending)
Wedge-like patterns that are found in the beginning or at the end of trends are known as diagonal triangles.
When this structure appears at the start of a trend, traders often call it an Elliott wave leading diagonal, while a similar formation at the end of a trend is known as an ending diagonal.
They have 5 overlapping waves that gradually move in the trend direction as volatility tends to compress.
The wave 1 or wave A shows a leading diagonal that can indicate the beginning of a new trend.
An ending diagonal in Wave 5 or Wave C signals that the prevailing trend is losing strength and a reversal may follow.
Chart example:
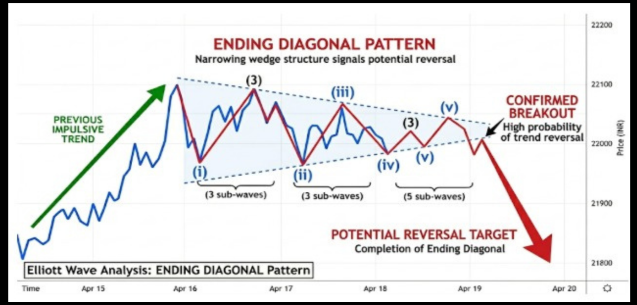
Look at the above stock chart, price forms higher highs, but each rally gets smaller while trend lines converge.
This narrowing wedge structure signals an ending diagonal before a potential reversal.
3. Flat Correction
Flat correction is a lateral pattern in which the price variations follow an A-B-C pattern, although the waves are quite equal. Wave B retraces approximately 90–100% of Wave A, returning close to its starting point.
Wave C then moves roughly the same distance as Wave A, ending near or slightly beyond Wave A’s end. Unlike a zigzag, a flat follows a 3-3-5 internal structure, reflecting a market that is consolidating rather than correcting deeply.
The evidence of this kind of correction is a market that is taking a pause but not a major turnaround.
4. Triangle Correction
Triangle corrections form when the price gradually tightens within converging trend lines.
This structure is commonly known as the Elliott wave triangle pattern and usually appears before a strong breakout.
It consists of five corrective sub-waves labeled A-B-C-D-E, each subdividing into three waves internally (3-3-3-3-3 structure); distinctly different from the five motive impulse waves.
These triangles represent market indecision. Buyers and sellers gradually compress price movement until a breakout occurs.
For example:
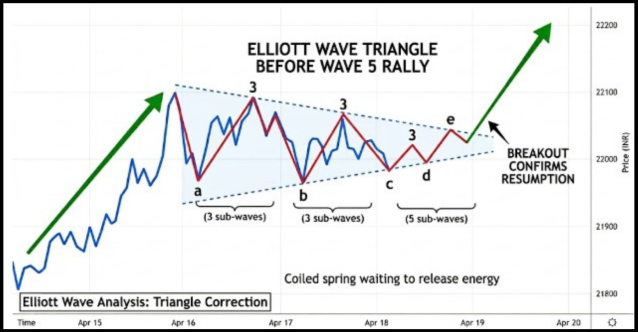
In a bullish market, a triangle may appear before the final Wave 5 rally, acting like a coiled spring waiting to release energy.
Common Mistakes When Drawing Elliott Waves
Even experienced traders mislabel waves. Markets are messy.
Common errors include:
- Forcing wave counts to fit predictions.
- Ignoring the Wave 3 rule.
- Misidentifying corrections as impulse waves.
- Using very small timeframes.
Practical advice:
| Good Practice | Reason |
| Start from a higher timeframe | Clear structure |
| Wait for confirmations | Avoid premature counts |
| Combine with support and resistance | Better context |
Remember, Elliott Wave is a framework, not certainty.
Conclusion
Learning how to draw the Elliott Wave pattern takes practice. Your first few charts will look confusing. That is normal.
Experienced traders often redraw wave counts several times as the price develops. What matters is understanding the market psychology behind each wave.
- Wave 1 begins quietly, unnoticed by most traders
- Wave 3 attracts the crowd as momentum builds
- Wave 5 peaks with excitement, often accompanied by momentum divergence.
Once you start seeing that rhythm on charts, the market begins to feel less random. Not predictable, but structured. And that structure gives traders an edge.
If you are serious about stock market trading and want to master it, join our stock market classes today and learn directly from expert traders.
FAQs
Q1: What Is The Easiest Way To Learn How To Draw Elliott Wave?
Ans: Start with higher-timeframe charts, such as daily or weekly.
The wave structure becomes clearer, making it easier to identify the five impulse waves and three corrective waves.
Q2: How Accurate Is Elliott Wave In Real Trading?
Ans: Elliott Wave helps identify potential market structure, but it is not a guaranteed prediction tool.
Traders usually combine it with support levels, Fibonacci retracement, and volume analysis.
Q3: What timeframe is best for Elliott Wave trading?
Ans: Most traders start on the daily chart to identify the big picture, switch to the 4-hour chart to draw the main waves, and use the 1-hour chart to refine entries.
The higher the timeframe, the cleaner and more reliable the wave structure tends to look.
Q4: Can Elliott Wave be used for crypto?
Ans: Yes, and it works quite well. Crypto markets are heavily driven by sentiment and crowd behavior, which is exactly what Elliott Wave is built on.
Bitcoin, in particular, has shown clear wave structures across multiple market cycles.
Just note that crypto moves faster than traditional markets, so wave counts can shift quickly.
Q5: Can Beginners Draw Elliott Wave On TradingView?
Ans: Yes. TradingView is a platform that integrates Elliott Wave drawing tools, enabling beginner users to label waves on a chart and adjust count colors as the market unfolds.
Before investing capital, invest your time in learning Stock Market.
Fill in the basic details below and a callback will be arranged for more information:


