Ever stared at a chart, feeling like you’ve almost caught the beginning of a new trend, but then missed it?
You’re not alone. Many traders feel that same twinge of excitement mixed with uncertainty.
That’s exactly how to identify Elliott Wave 1, which becomes not just a theoretical exercise, but a skill that can shift your market decisions.
Getting Wave 1 right makes your trades more accurate and confident, so you don’t have to guess where to enter or exit.
Let’s walk through it like a trader chatting with a friend: simple, practical, and straight to the point.
How To Identify Wave 1 in Elliott Wave?
Before we get technical, ask yourself: Is this the start of something new?
That’s the heart of identifying wave 1, spotting a move that marks a shift in trend, often before most others even realize it.
In Elliott Wave Theory, there are five consecutive waves in the direction of the trend and then three corrective waves in the opposite direction of the trend.
Wave 1 refers to the first step of a new cycle. It’s the spark before the fire.
Key practical traits of Wave 1:
- It kicks off after a significant low or the end of a prior trend.
- Just a few early traders leap in.
- Sentiment remains doubtful, and the market remains bearish, despite rising prices.
Consider it in this way: there are early birds, who come at the time of sunrise, and most of us are asleep. The sun had already risen, but most of the world had yet to notice.
How to Confirm Wave 1 in Elliott Wave?
To really nail how to identify Elliott Wave 1, you need structural confirmation, not just hope.
Here’s what to check on your chart:
1. Five Sub‑Waves Move Up
Wave 1 isn’t a single straight line. To truly understand Elliott Wave formation, you have to look for five sub-waves (smaller waves) within it.
These mini swings form the actual impulsive push.
However, if the move looks wedge-shaped and overlapping, you might be looking at an Elliott Wave leading diagonal.
This is a specific type of Wave 1 where the internal sub-waves follow a different set of rules.
Whether it is a standard impulse or a diagonal, the internal structure generally follows this path:
- Sub‑wave 1: small initial leg up
- Sub‑wave 2: shallow pullback
- Sub‑wave 3: another push up
- Sub‑wave 4: sideways dip
- Sub‑wave 5: final part of Wave 1
Seeing this structure gives you confidence that it’s not just noise.
2. Clear Higher Highs and Higher Lows
Wave 1 is often an uptrend (in bullish markets). That means each swing high is higher than the last, and each pullback doesn’t dip as low as before.
It’s simple, look at the pattern of price swings. If they’re consistently climbing, that’s your structural fingerprint.
3. Trend Reversal Point
Wave 1 starts where the market shifts behavior. That’s often a test of the prior low followed by a breakout, completing a broader Elliott Wave reversal pattern.
If the market clearly rejects lower levels and starts making upward swings, you’re in the right zone.
How To Identify Elliott Wave Using MACD?
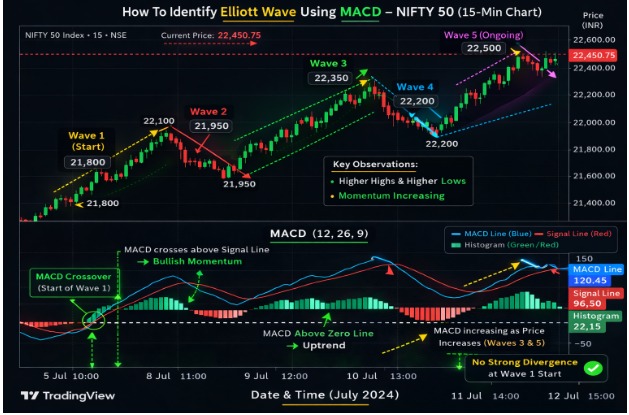
Now here’s the practical question traders ask: can indicators confirm a new Elliott impulse? They can help, and MACD is one of the most useful.
First, remember the Initial Impulse rule. Wave 1 must form a clear 5-wave motive structure on a lower timeframe. If the move breaks into only three waves, it is not a new trend. It is just a correction.
Many traders get trapped here. MACD does not label waves, but it gives momentum context.
Here is what to watch:
- MACD Crossover: If the MACD line crosses above the signal line near the suspected start of Wave 1, it signals an early momentum shift.
- MACD Zero Line Cross: When MACD moves above the zero line, it often suggests Wave 1 is transitioning into Wave 3. That is where strength usually expands.
- Momentum Confirmation: If the price rises and the MACD expands upward, especially after being below zero, it supports a developing impulse. Strong divergence usually appears later, often near Wave 5.
For entry, experienced traders wait. The smarter approach is the Wave 2 pullback entry. After Wave 1 completes, wait for a 50 to 61.8 percent retracement in Wave 2.
Incorporating Elliott wave time analysis during this phase can help you anticipate how long the correction might last before the next impulse begins.
Enter there with a tight stop below Wave 2 low.
Common Mistakes When Identifying Wave 1
Even seasoned traders trip up here, so let’s be honest about common slips:
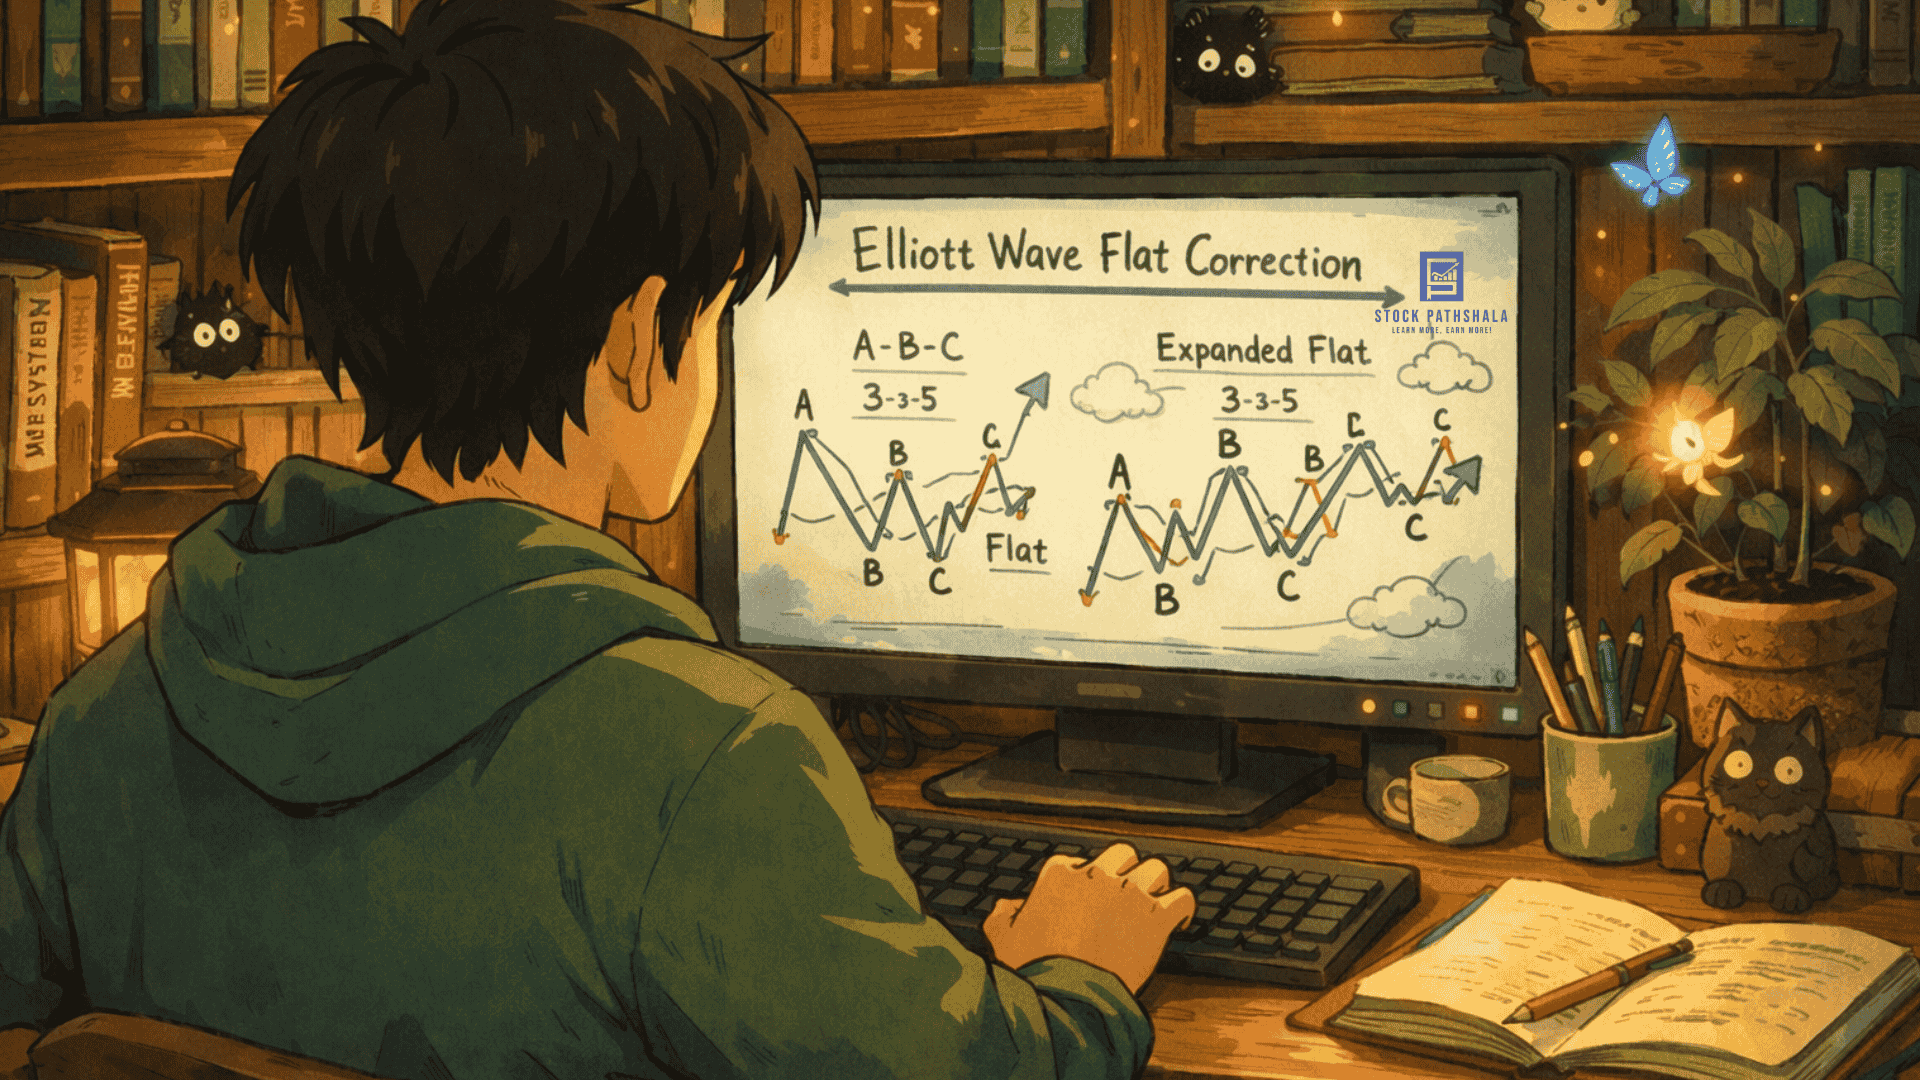
- Mistake #1: Assuming every bounce is Wave 1. Sometimes, what looks like a new trend is actually just a sideways trap, such as an Elliott Wave flat correction, which tricks buyers before the previous trend resumes.
- Mistake #2: Ignoring rules like Wave 2 not retracing beyond the Wave 1 starting point. If Wave 2 goes below that start, your count is invalid.
- Mistake #3: Overfitting patterns, meaning you try to force the count to look like Wave 1 even when the market action doesn’t support it.
- Mistake #4: Relying too much on one indicator. MACD helps, but it doesn’t replace the actual price structure.
If you want to see how these structural counts compare to traditional charting, check out our guide on key differences between Elliott Wave vs Price Action.
Conclusion
Spotting how to identify Elliott Wave 1 is part art, part structure. It’s less obvious than wave 3 or wave 5, but it’s where the opportunity begins.
Once you get your sense of direction and can identify the trend change, support it with swing lows and highs, and verify momentum using an indicator, such as MACD, you are not guessing anymore; you are analyzing.
Wave 1 can be subtle at first, but as you practice, your timing will be more precise.
If you want to master Elliott Wave 1 with clarity and confidence, then join our Elliott Wave mentorship program and receive personalized guidance to elevate your trading skills.
For more details, book a counselling session today!
FAQs
Q1: How to identify wave 1 in Elliott Wave?
Ans: Wave 1 tends to begin following a trend reversal and creates a minor yet distinct upward or downward movement.
In an uptrend, seek higher lows and higher highs, with five sub-waves in the movement, early momentum, usually with prudent market opinion.
Q2: Is there any indicator for Elliott Wave?
Ans: No single indicator can automatically determine Elliott waves.
Momentum and direction of trend could be validated using tools such as MACD, RSI, and moving averages, but the number of waves is dependent on the price structure and pattern analysis.
Q3: Can MACD alone confirm Wave 1?
Ans: No. MACD can show momentum shifts that support a potential Wave 1, but it cannot confirm it alone. Wave 1 must be validated through actual price movement and wave structure on the chart.
Before investing capital, invest your time in learning Stock Market.
Fill in the basic details below and a callback will be arranged for more information: