
The market moves fast. One candle can make you feel like a genius. The next can humble you in seconds. That is why structure matters.
If you are serious about intraday trading, you need a framework that explains momentum, pullbacks, and reversals.
That is where learning how to use Elliott Wave for intraday trading changes the game.
It is not magic. It is crowd psychology mapped into waves.
Let us break it down practically.
What Is The Elliott Wave Theory For Intraday?
It is the same five-wave impulse and three-wave correction model, but applied on smaller time frames.
Understanding the core Elliott Wave formation and identifying the specific corrective pattern that follows an impulse move is essential for timing entries:
- Wave 1 starts a move
- Wave 2 corrects
- Wave 3 expands strongly
- Wave 4 pulls back
- Wave 5 completes the trend
Then comes an ABC correction.
In intraday trading, these waves form within a single session. Sometimes even within two hours.
Here is the key. Wave 3 is usually the strongest. Wave 2 and Wave 4 are corrective and often respect Fibonacci levels.
That predictability is what traders use to identify wave patterns before the big move happens.
How To Use Elliott Wave For Intraday Trading In Real Markets?
Theory is fine. But how do traders actually apply it?
Let us explain step by step:
1. Spot The Intraday Impulse
Start with the broader market context. Always check the higher time frame bias first. If NIFTY is clearly bullish on the daily chart, chances are most intraday wave structures will lean in that direction.
Trading against that bias is possible, but it’s harder and riskier.
Now shift to the 15-minute chart and slow down.
- Look for a strong impulsive push supported by noticeable volume.
- Mark that move as a potential Wave 1.
- Do not chase it. Wait for a clear three-wave pullback to form Wave 2.
Here’s something beginners often ignore: intraday waves can be noisy. Sudden news, global cues, or unexpected data releases can distort clean structures.
A spike can look like a breakout, then reverse in minutes. That noise doesn’t cancel Elliott rules, but it does demand patience.
And this rule is non-negotiable: Wave 2 must never retrace below the start of Wave 1. Not even by a small margin. If the price breaks that level, your wave count is wrong.
No debate. No adjustment to “make it fit.” Accept it and reassess.
This is where most losses begin. Traders anticipate Wave 2 completion too early. They enter before the structure confirms.
The market punishes impatience, especially on lower time frames.
2. Trade The Wave 3 Expansion
Wave 3 often offers strong momentum.
How to use Elliott wave in trading effectively?
Focus on Wave 3 entries.
Example scenario:
- Bank NIFTY breaks morning high
- Pulls back to 50 percent Fibonacci of Wave 1
- Forms a bullish candle near VWAP
That pullback can be Wave 2.
Entry near the end of Wave 2 gives:
- Tight stop below Wave 1 start
- Strong upside potential
Wave 3 of Elliott wave cycle often extends 1.618 times Wave 1. That is not random. It is common behavior.
When price accelerates with strong candles and rising volume, you are likely inside Wave 3.
Do not exit too early. Trail stops instead.
3. Catch The Wave 5 Exhaustion
Wave 5 is tricky. It looks strong, but momentum often weakens.
Signs of Wave 5 in intraday charts:
- Price makes a new high
- RSI shows divergence
- Volume reduces
Many traders get trapped buying here.
If you understand how to use Elliott wave theory for trading, you will reduce position size in Wave 5 or look for reversal setups once five waves are complete.
After five waves, expect an ABC correction. Intraday scalpers often trade the A wave breakdown after Wave 5 completion, specifically looking for a confirmed Elliott Wave reversal pattern to signal the end of the trend.
Here is the honest part. Elliott Wave is powerful but subjective. Let us take a practical case.
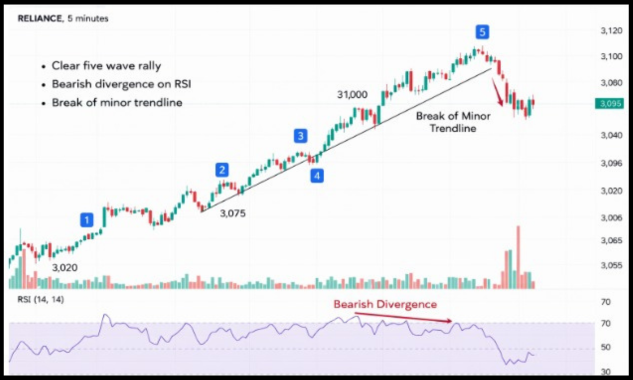
RELIANCE on 5-minute chart forms:
- Clear five-wave rally
- Bearish divergence on RSI
- Break of minor trendline
Instead of blindly shorting, wait for confirmation. Enter after Wave A of correction with stop above recent high.
Risk should be defined before entry:
- Maximum 1 to 2 percent of capital per trade
- Fixed stop based on structure
- No averaging down
Intraday volatility can distort wave counts. News events can invalidate setups. Accept that.
Trading is less about being right and more about managing when you are wrong.
How To Use Elliott Wave In Trading With Support Tools?
Elliott Wave Theory works best when it is combined with other technical tools that confirm the wave structure.
Since wave counting can sometimes be subjective, traders increase the reliability of their analysis by using confirmation indicators such as support and resistance levels, trendlines, moving averages, volume analysis, and momentum indicators like RSI or MACD.
For example, if a potential wave-3 breakout is supported by strong volume and a momentum indicator showing bullish strength, the probability of a successful trade becomes higher.
Similarly, Fibonacci retracement levels can help identify where wave-2 or wave-4 corrections may end.
By combining Elliott Wave analysis with these supporting tools, traders can filter false signals and make more confident trading decisions instead of relying on wave counts alone.
Let’s understand this in more detail.
Elliott Wave Theory with Fibonacci
Fibonacci ratios bring objectivity.
Common relationships:
- Wave 2 retraces 38 percent to 61 percent of Wave 1
- Wave 3 extends 1.618 times Wave 1
- Wave 4 retraces 23 percent to 38 percent of Wave 3
Common Intraday Retracement Zones
|
Wave |
Typical Fibonacci Zone |
|
Wave 2 |
38 percent to 61 percent |
|
Wave 4 |
23 percent to 38 percent |
If the price respects these zones and forms reversal candles, the probability improves.
You know what? Even experienced traders miscount waves. That is normal.
The structure becomes clearer with practice. To become a pro in Elliott wave analysis, join Elliott Wave mentorship now.
Conclusion
Elliott Wave Theory helps you read the structure of the market. It shows where the crowd is becoming excited, where momentum is slowing down, and where panic or sharp reversals may begin.
When you start recognizing these patterns, price charts no longer look random; they begin to reveal the psychology of buyers and sellers.
The key is consistent practice. Use replay charts, mark potential waves every day, and review your mistakes to refine your understanding.
Over time, your ability to identify high-probability setups improves.
In short, when Elliott Wave analysis is combined with discipline, patience, and confirmation tools, it becomes a powerful framework for understanding market behavior and making more confident trading decisions.
If you want to accelerate your learning and see these setups in live markets, then join our stock market classes to build a professional trading foundation.
FAQs
Q1: What Is The Elliott Wave Procedure Intraday?
Ans: It applies the five-wave impulse and three-wave correction structure on small time frames, like 5-minute or 15-minute charts for same-day trades.
Q2: How Reliable Is Elliott Wave For Intraday Trading?
Ans: It works well when combined with Fibonacci, volume, and trend context. Alone, it can be subjective.
Q3: Which Wave Is Best To Trade Intraday?
Ans: Wave 3 offers the highest probability because it usually shows strong momentum and clear expansion.
Before investing capital, invest your time in learning Stock Market.
Fill in the basic details below and a callback will be arranged for more information:


