

A strong rally starts. Price moves fast. Pullbacks feel shallow. News turns bullish. You feel the urge to jump in before it runs away.
That is usually where the impulse wave pattern shows up.
Let’s make it simple.
Markets move in cycles of expansion and correction.
The impulse phase is the expansion. It is the part where momentum is clear, structure is clean, and crowd psychology is one-sided.
If you understand this phase well, you stop chasing price blindly. You start reading it.
Let’s get into the details to understand how it helps you in making a trading decision.
What Is The Impulse Wave Pattern?
The pattern for impulse waves is a 5-wave pattern that travels in the direction of the principal trend.
It is the basis of the Elliott Wave theory as developed by Ralph Nelson Elliott.
An impulse consists of:
- Wave 1: Initial move
- Wave 2: Pullback
- Wave 3: Strong expansion
- Wave 4: Controlled correction
- Wave 5: Final push
Waves 1, 3, and 5 move with the trend.
Waves 2 and 4 move against it.
Understanding the difference between an Impulsive vs Corrective Wave is the foundation of this strategy.
Simple in theory. Harder in real markets. But once you see it clearly, you cannot unsee it.
Structure Of The Elliot Impulse Wave Pattern
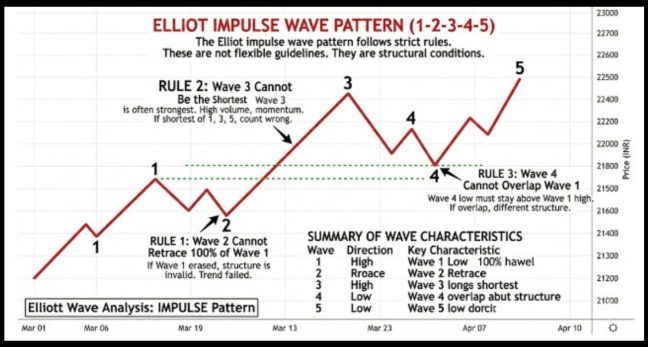
The Elliot impulse wave pattern follows strict rules. These are not flexible guidelines. They are structural conditions.
- Rule 1: Wave 2 Cannot Retrace 100 Percent of Wave 1
If the price completely erases Wave 1, the structure is invalid. The trend attempt failed.
- Rule 2: Wave 3 Cannot Be the Shortest
Wave 3 is often the strongest and longest. It usually carries high volume and momentum. If it is the shortest of Waves 1, 3, and 5, the count is wrong.
- Rule 3: Wave 4 Cannot Overlap Wave 1
In a standard impulse, Wave 4 does not enter the price territory of Wave 1. If it overlaps, you are likely looking at a different structure, such as a corrective pattern.
Note: The only exception to this in a motive move is the Elliott wave leading diagonal, which specifically allows for overlap to create a wedge-like appearance.
Here is a quick summary:
| Wave | Direction | Key Characteristic |
| 1 | With trend | Early positioning |
| 2 | Against trend | Sharp retracement |
| 3 | With trend | Strong momentum |
| 4 | Against trend | Sideways or mild correction |
| 5 | With trend | Final push |
This structure reflects psychology. Optimism builds in Wave 1. Doubt appears in Wave 2. Confidence explodes in Wave 3. Profit booking starts in Wave 4. Euphoria peaks in Wave 5.
That emotional rhythm is real.
How To Identify Impulse Wave Pattern In Live Markets?
This is where traders struggle. You cannot label waves randomly. You need confirmation from price behavior.
Here is how to identify the impulse wave pattern practically:
1. Look For A Clear Trend
Impulse waves do not start in choppy markets. Check higher timeframes.
Is the market trending?
For example, if NIFTY breaks a major resistance with strong candles and volume expansion, Wave 1 may be forming.
2. Measure Retracements
Wave 2 very often retraces 50 to 61.8 percent of Wave 1 with the help of Fibonacci levels.
If retracement comes as shallow and momentum is not broken, then structure is in place.
3. Watch Wave 3 Closely
Wave 3 often extends to 1.618 times Wave 1. Momentum indicators usually expand here.
Volume increases. Breakouts happen fast.
This is where most traders finally believe the trend.
4. Observe Wave 4 Behavior
Wave 4 tends to be sideways. It often forms triangles or flat corrections.
It is during this phase that you must strictly apply the Elliott wave 4 rules to ensure the trend is still healthy. If the price remains sideways and respects the price territory of Wave 1, the impulse is confirmed.
This is the stage where you must learn to spot a Market Correction to distinguish it from a total trend reversal.
By observing how the market “breathes” here, you can prepare for the Wave 5 breakout.
5. Wave 5 And Divergence
In many cases, indicators show divergence in Wave 5. Price makes a higher high, but momentum slows.
That signals possible exhaustion.
It is not magic. It is structure plus probability.
Real Trading Scenario Example
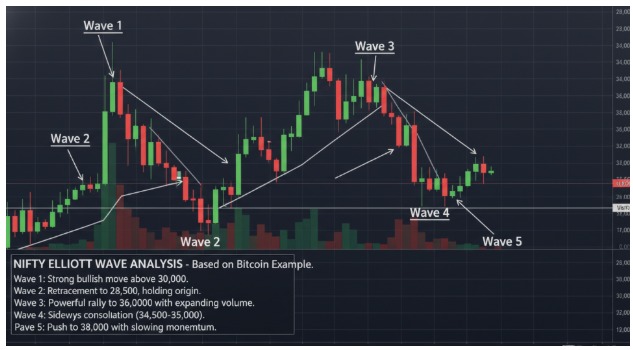
Let us take the above Bitcoin daily chart.
Bitcoin breaks above 30,000 with strong bullish candles. That could be Wave 1.
Price retraces to 28,500. It holds above the origin. That fits Wave 2. Then comes a powerful rally to 36,000 with expanding volume. That is likely Wave 3.
A sideways consolidation between 34,500 and 35,500 forms next. That becomes Wave 4. Finally, price pushes to 38,000 with slowing momentum. Wave 5 completes.
A trader who identified Wave 2 correctly could enter early with defined risk below Wave 1. A trader who waits for Wave 3 breakout trades momentum.
Risk Management During Impulse Waves
Here is the contradiction. Impulse waves look clean, but trading them blindly is risky.
Common mistakes:
- Entering at the end of Wave 5
- Mislabeling corrective waves as impulses
- Ignoring invalidation rules
Practical risk rules:
- Place a stop below Wave 2 in the bullish structure
- Trail stop during Wave 3 expansion
- Reduce position size near Wave 5
Markets do not care about your wave count. Respect invalidation points.
Conclusion
The impulse wave pattern is not just a theory. It is a structured way to read crowd behavior.
When you combine price structure, Fibonacci logic, and momentum confirmation, the market stops looking random. It starts looking rhythmic.
Learn the rules. Practice on live charts. Over time, the Elliot impulse wave pattern is not so much labeling of waves as pressure, conviction, and timing.
For those who want to master these counts with precision, an Elliott Wave mentorship can provide the hands-on guidance needed for professional trading.
FAQs
Q1: What Is The Impulse Wave Pattern In Layman’s Words?
Ans: It is a five-wave price structure that moves in the direction of the basic trend. 3 waves move up, and 2 come back.
Q2: Which Is The Strongest Wave In Elliot Impulse Wave Pattern?
Ans: Wave 3 is typically the most powerful and longest. High momentum (and volume expansion) is often exhibited.
Q3: Can Indicators Alone Identify Impulse Wave Pattern?
Ans: No. Indicators only confirm momentum or trend strength. Proper wave identification depends on the price structure first.
Want to understand the Impulse Wave Pattern step by step with real chart examples?
Our stock market classes offer detailed practical sessions and live market breakdowns. Download the Stock Pathshala app to start your journey today!
Before investing capital, invest your time in learning Stock Market.
Fill in the basic details below and a callback will be arranged for more information:


