

Markets do not move randomly. They surge. They pause. Then they surge again. And if you watch closely, you start to notice rhythm. That rhythm is what the motive wave Elliott pattern tries to explain.
At its core, this pattern describes the impulsive phase of a trend. It is the part where the price moves strongly in the direction of the main trend.
In Elliott Wave theory, markets move in five waves during a trending phase. The motive phase is that five-wave push.
Here’s the thing. Not every rally is random noise. When price moves with structure, volume confirmation, and clear wave progression, traders call it an Elliott motive wave.
Let us break it down.
What Is The Motive Wave Elliott Pattern?
The motive wave Elliott pattern is the five-wave structure that moves in the direction of the main trend in Elliott Wave theory.
It represents the strong, impulsive phase of the market where price pushes forward with momentum.
In simple terms, it is the part of a trend where buyers or sellers are clearly in control. The structure follows a 1 2 3 4 5 sequence, with Wave 3 usually being the strongest move.
Traders use this pattern to identify trend continuation and position themselves during high probability moves.
Structure Of An Elliott Motive Wave
Before you apply it, you need to understand how a motive wave Elliott wave is built.
This 5-wave sequence is the foundation of the Elliot impulse wave pattern.
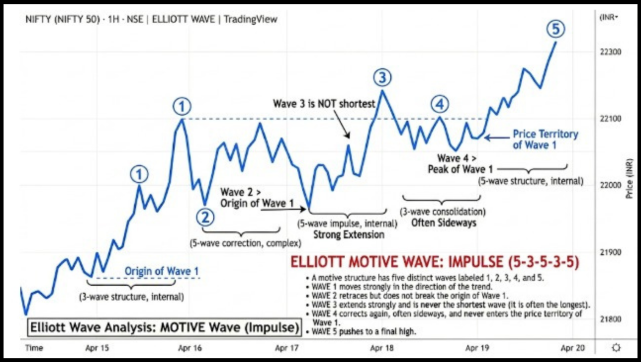
A motive structure has five waves labeled 1, 2, 3, 4, and 5.
- Wave 1 moves with the trend; traders often look for a lead-in to spot Elliott Wave 1 early.
- Wave 2 retraces but does not break the origin of Wave 1.
- Wave 3 extends strongly and is never the shortest.
- Wave 4 corrects the previous move. While it can be a sharp dip, it often moves sideways, taking the shape of an Elliott wave triangle pattern before the final breakout.
- Wave 5 pushes to a final high or low.
That is the backbone of motive waves.
Motive Wave Rules
These rules matter. If they fail, the count is wrong.
| Rule | Explanation |
| Wave 2 | Cannot retrace beyond the start of Wave 1 |
| Wave 3 | Cannot be the shortest among 1, 3, 5 |
| Wave 4 | Cannot overlap Wave 1 in most cases |
These are not suggestions. They are structural rules that separate a motive move from an Elliot corrective pattern.
Types Of Motive Waves
Not all types of Motive Waves look identical. There are two main structures traders watch.
1. Impulse Wave
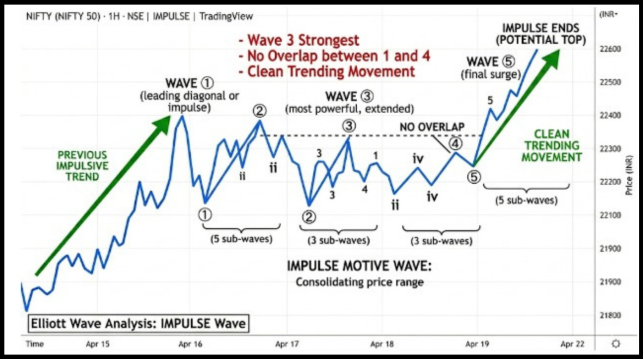
This is the standard pattern most traders refer to when discussing the motive wave Elliott pattern.
- Five clear waves
- Wave 3 strongest
- No overlap between 1 and 4
- Clean trending movement
You often see this in strong trending stocks like Reliance during breakout phases or Nifty during budget week rallies.
2. Leading Diagonal
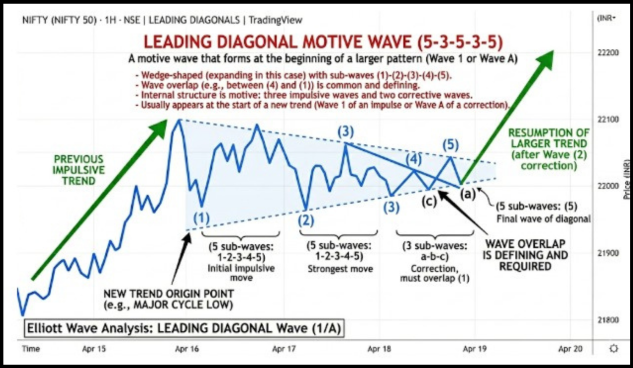
This pattern usually shows up at the beginning of a new trend, right when the market is trying to shift direction.
- It has a clear wedge shape, where price moves narrow and overlaps, almost like pressure building inside a tight space.
- Wave overlap is allowed here, which makes it look messy compared to a clean impulse move.
- Momentum does not explode immediately. Instead, it builds gradually, as if the market is testing the waters.
- You will often see it forming in Wave 1 or Wave A, especially after a long consolidation phase.
Think of a stock that has been moving sideways for weeks. Buyers and sellers are balanced. Then the price starts edging upward, but not aggressively.
The swings tighten. Each push is slightly higher, yet pullbacks overlap. It feels slow. Some traders mistake it for just another range.
But here is the difference. That wedge is not random noise. It is the market quietly gathering strength before a stronger breakout move.
How Traders Identify Motive Waves On Charts?
Theory sounds nice. But how do traders actually use this?
First, they mark swing highs and swing lows. Then they check the structure.
Step-by-Step Practical Approach
- Identify a clear directional move.
- Count five potential waves.
- Check rules for invalidation.
- Confirm Wave 3 with momentum.
Let’s take a Nifty 5-minute chart.
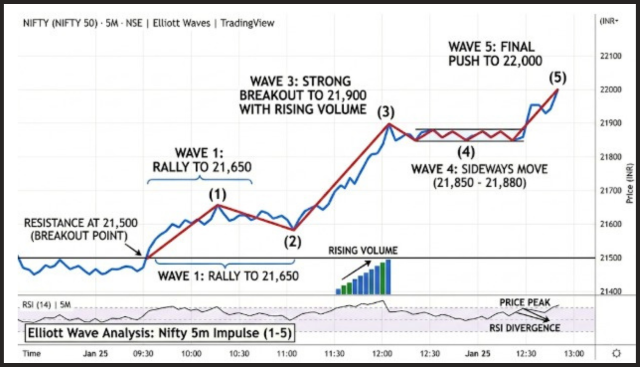
- Nifty breaks above resistance at 21,500.
- It rallies to 21,650. That could be Wave 1.
- A pullback to 21,580 holds above the origin. That forms Wave 2.
- A strong breakout to 21,900 with rising volume signals Wave 3.
- Price then moves sideways between 21,850 and 21,880, forming Wave 4.
- Finally, a push to 22,000 with RSI divergence suggests Wave 5.
That is a textbook motive structure.
Notice something important. Wave 5 often shows weaker momentum. RSI might form lower highs while the price makes higher highs. That signals exhaustion.
Risk Management During Motive Waves
This is where many traders get emotional.
They see Wave 3 and chase the price. Then Wave 4 pulls back, and fear kicks in.
Here is how experienced traders manage it:
- Enter on Wave 2 retracement.
- Add during Wave 3 breakout.
- Trail stop below Wave 4 low.
- Exit near Wave 5 divergence.
It sounds simple. It is not easy.
The risk lies in miscounting waves. If Wave 3 fails to extend, you may actually be trading inside a correction.
Always define invalidation levels.
Common Mistakes With Motive Waves
Honestly, most beginners force the count.
They label every small move as 1 2 3 4 5. That leads to confusion.
Here are common errors:
- Ignoring rule violations
- Forcing symmetry
- Entering late in Wave 5
- Ignoring the higher time frame trend
Remember, a five-wave move on 5 minute chart might just be Wave 1 on the daily chart.
Conclusion
The motive wave Elliott pattern is not magic. It is a structural lens.
It helps you see where momentum builds, where exhaustion forms, and where risk hides.
Used properly, it keeps you calm during volatility. Used blindly, it creates false confidence.
Study it. Practice marking it on historical charts. Track how Wave 3 behaves in different stocks. Over time, your eyes become sharper.
And once you start seeing structure, random price action no longer feels random.
FAQs
Q1: What Is A Motive Wave In Elliott Theory?
Ans: A motive wave is a five-wave move that travels in the direction of the main trend. It represents the impulsive phase of market movement.
Q2: How Do I Confirm Wave 3 In A Motive Wave Elliott Pattern?
Ans: Wave 3 usually shows the strongest momentum and volume expansion. It should not be the shortest wave among 1, 3, and 5.
Q3: Can Motive Waves Fail?
Ans: Yes. If price breaks key rules such as Wave 2 retracing beyond Wave 1 origin, the count is invalid and must be reassessed.
Want to master the Motive Wave Elliott Pattern with real chart examples and live market sessions?
Join our classes in stock market today to build a professional trading foundation!
Before investing capital, invest your time in learning Stock Market.
Fill in the basic details below and a callback will be arranged for more information:


