


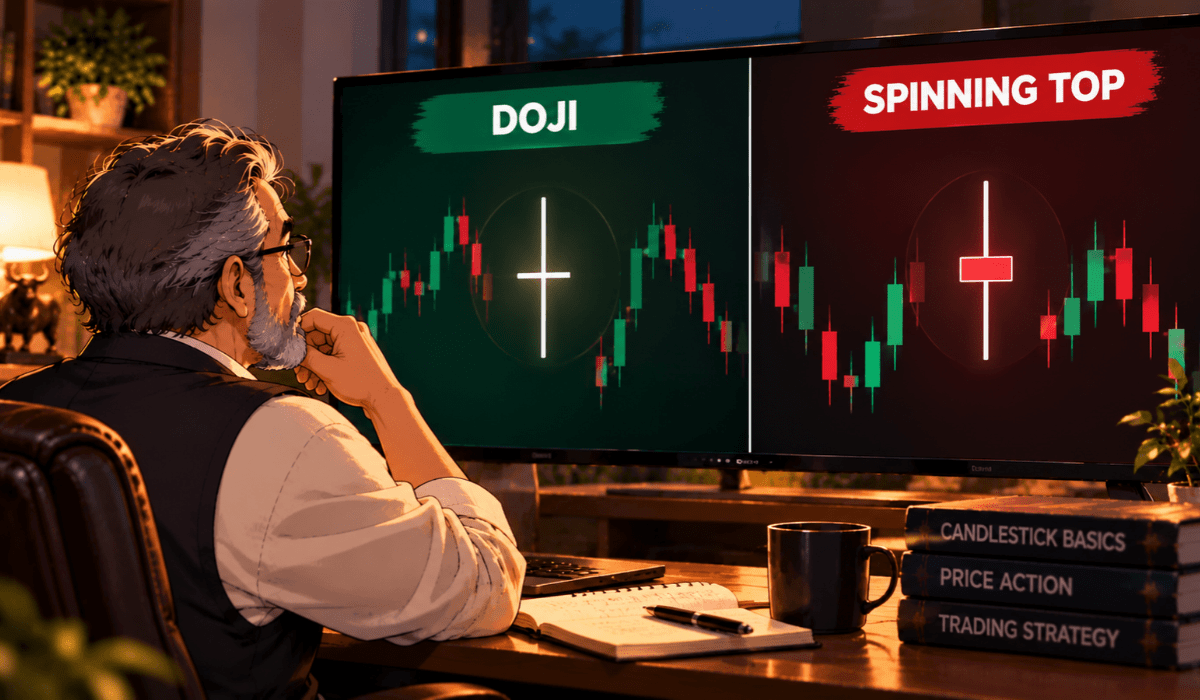
When you open a chart and see a tiny candle with long shadows, deciding whether it is a doji vs spinning top can be tricky. Many beginners mix up these two candlestick patterns.
So, here is the doji vs spinning top difference in one line: both show indecision. However, the doji has an almost invisible body, and the spinning top has a small but visible one.
Doji vs Spinning Top: What Do They Have in Common?
First, both candles tell you that buyers and sellers fought hard and neither side won clearly.
Each has a small real body and shadows on both sides. That is why they look so alike at a glance.
Besides, traders read both as a pause, not as a signal to act. In fact, the market is just catching its breath.
Doji vs Spinning Top: Body Size Difference With Examples
The real body is the gap between the open and the close. This is the one thing that separates the two candles.
In a doji, the open and close are almost the same price. So, the body is a thin line or a very small dash.
In a spinning top, the close is a little away from the open. However, the body is small but you can clearly see it.
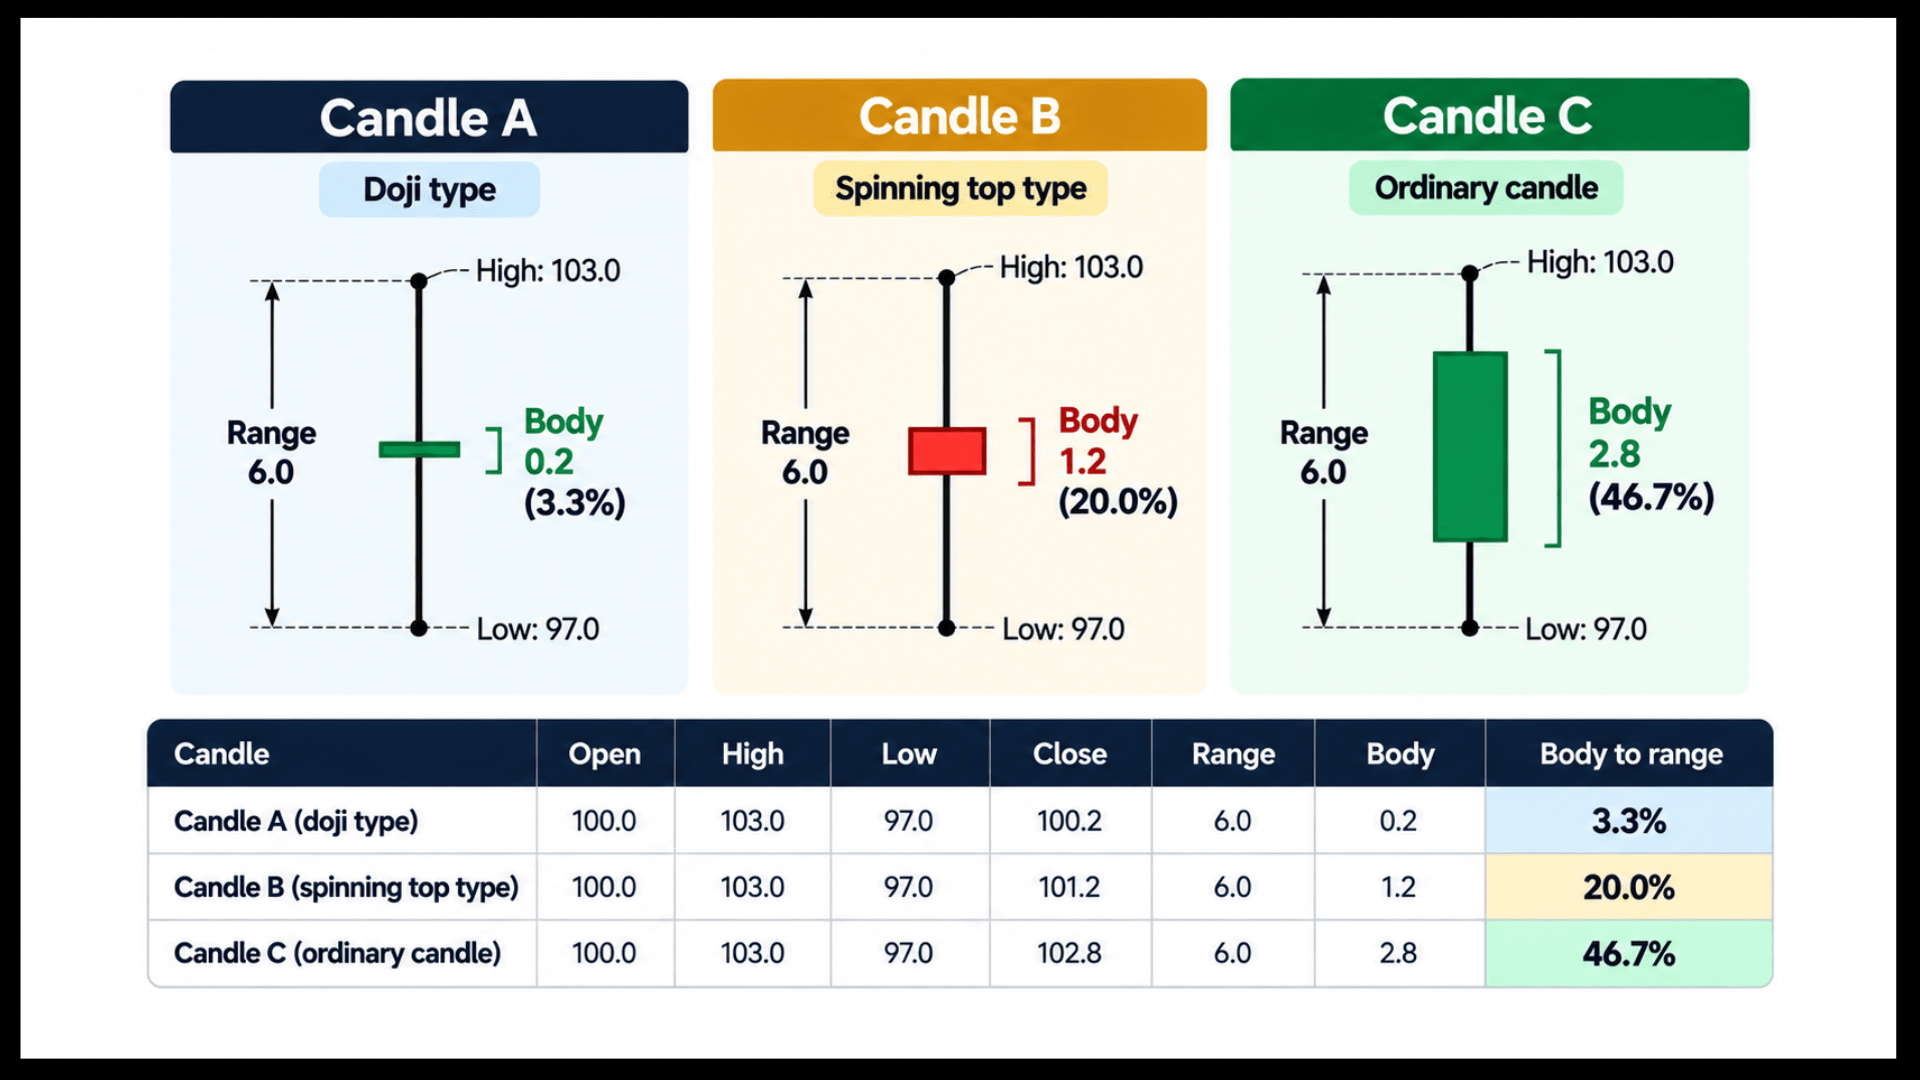
The table below shows three hypothetical candles. Each has the same range, so only the body changes.
The body-to-range ratio is body size divided by (high minus low), multiplied by 100.
| Candle (for illustration only) | Open | High | Low | Close | Range | Body | Body to range |
|---|---|---|---|---|---|---|---|
| Candle A (doji type) | 100.0 | 103.0 | 97.0 | 100.2 | 6.0 | 0.2 | 3.3% |
| Candle B (spinning top type) | 100.0 | 103.0 | 97.0 | 101.2 | 6.0 | 1.2 | 20.0% |
| Candle C (ordinary candle) | 100.0 | 103.0 | 97.0 | 102.8 | 6.0 | 2.8 | 46.7% |
Candle A has a body of only 3.3% of its range, so it reads as a doji. Candle B sits at 20%, a typical spinning top.
Finally, candle C has a strong body and is not an indecision candle at all.
However, there is no official cut-off. Most traders treat a body under roughly 5% of the range as a doji and around 10% to 30% as a spinning top.
Still, treat these as rules of thumb, not laws.
Doji vs Spinning Top: Shape and Shadow Comparison
Shadows add detail, but they do not decide the name. Also, both candles can have long or short shadows.
A doji can also appear in special forms, such as long-legged, dragonfly or gravestone. If you want to see how those variants differ, read dragonfly doji vs gravestone doji separately.
A spinning top usually has shadows of similar length on both sides. Also, its close can be slightly above or below the open, and the colour of the body matters very little.
Now, the next table puts the main points side by side.
| Feature | Doji | Spinning top |
|---|---|---|
| Open and close | Almost equal | Close to each other, but not equal |
| Real body | Almost a line | Small but visible |
| Shadows | Usually present, can be long or short | Usually long on both sides |
| Body colour | Not important | Not important |
| Indecision strength | Stronger | Milder |
| Variants | Long-legged, dragonfly, gravestone | Mostly one standard shape |
What Does a Doji or Spinning Top Indicate? Understanding Indecision
Indecision means buyers and sellers were balanced during that candle. Price moved up and down but came back near where it began.
First, a doji shows an almost perfect tie. Neither side could push the close away from the open.
In contrast, a spinning top shows a near tie. One side had a small edge, but not enough to call it a win.
If you want the full story of the doji candlestick on its own, what does a doji candle indicate it’s covered separately. Here we only look at how it compares with the spinning top.
This matters because the two candles can lead to different reactions. So, a tie is a stronger pause than a near tie.
When Does a Doji or Spinning Top Matter on a Chart?
Context decides everything. The same candle means different things in different places.
After a long, strong move, an indecision candle may hint that the move is tiring. However, in a sideways, choppy market, it means almost nothing.
A doji matters more near an important support or resistance zone, because the tie happens where traders already pay attention.
Similarly, a spinning top matters when it shows up after a run of big-bodied candles, since the shrinking body shows the energy fading.
To understand why traders react this way, the psychology behind candle patterns is worth a read.
Why You Need the Next Candle to Confirm a Doji or Spinning Top
In short, neither candle is a signal by itself. Both only say “undecided”.
So, the candle that follows gives you the clue. For example, a strong candle in one direction shows who took control.
Many traders wait for that confirmation candle and check volume before they take any decision. Waiting costs you a few points, but it can save you from a false move.
If you want a full process for entries, stops and targets, see this note on how to trade doji candlestick pattern step by step. This page stays on the comparison.
Doji and Spinning Top Mistakes Beginners Make
Most losses around these candles come from reading too much into one bar. So, here are the usual errors to avoid.
- Calling every small candle a doji. Check the body-to-range ratio instead of guessing by eye.
- Trading the candle alone. Without trend, level and confirmation, it is only a shape.
- Ignoring the time frame. A doji on a 1-minute chart carries far less weight than one on a daily chart.
- Expecting a reversal every time. Indecision can also end with the old trend continuing.
- Skipping the stop-loss. A wrong read on a doji can hurt as much as any other mistake.
Fear of missing out makes people jump in early. However, a small pause in the plan usually helps more than a quick click.
Also, keeping a candlestick pattern book nearby helps you check names and shapes instead of guessing them from memory.
Doji and Spinning Top False Signals and Limits
Candle patterns are not magic. In fact, both the doji and the spinning top fail often, especially in noisy markets.
For example, low volume, news spikes and thin sessions can produce these candles without any real meaning. Also, different chart tools may label the same bar differently.
So use them as one input among many, together with trend, levels and your risk plan. A mentor reviewing your chart reading can help you spot your own blind spots faster.
If you want to build this skill in a planned order, you can learn candlestick patterns step by step, starting with the single-candle shapes.
How to Practise Spotting a Doji and Spinning Top
Now, reading about these candles is easy. However, spotting them on real charts takes practice.
Open a chart and mark ten indecision candles from the past. Then, for each one, measure the body-to-range ratio and write down what the next candle did.
This simple habit builds your eye better than any theory. Our note on how to read candlestick pattern can help you begin with the basics.
Every trader begins by misreading candles, so be patient with yourself. Feelings matter here.
Many beginners feel pressure to act on every candle, and a journal slowly removes that pressure.
Do you also want to tell a doji from a spinning top on live charts, with someone checking your work? In our live classes, you can join from your mobile, ask your doubts, and learn step by step.
Watching videos alone rarely builds chart sense. Instead, real charts, personalised mentorship and honest feedback make the real difference.
Conclusion
Here is the short version to remember. A doji has its open and close almost equal, so the body is nearly a line.
In contrast, a spinning top has a small visible body, with shadows on both sides.
Both show indecision, although the doji shows it slightly more strongly. In other words, a doji is a tie, while a spinning top is a near tie.
However, neither candle is a signal without context and confirmation. So, always check the trend, the nearby level and the next candle first.
Also, remember that a small pause in your plan usually helps more than a quick click. A wrong read can hurt, so keep your stop-loss in place.
Finally, practise on past charts for a few weeks before you risk real money. Over time, you will tell these two candles apart at a glance.
Disclaimer: This content is for education only and is not investment advice. All numbers are hypothetical and for illustration only. Markets carry risk, and past patterns do not guarantee future results.
Frequently Asked Questions
Before investing capital, invest your time in learning Stock Market.
Fill in the basic details below and a callback will be arranged for more information: