

What if the move you thought was a reversal turned out to be just a trap set by the market?
In Elliott Wave theory, there is a pattern that does exactly that.
The double corrective pattern, labeled W-X-Y, is a two-stage correction that fools traders into entering too early, shaking them out before the real trend continuation begins.
It is not chaos, but it is structured, and understanding it could be the difference between exiting a trade in frustration and holding it all the way to your target.
When you learn to draw Elliott wave structures accurately, you realize that these complex pullbacks are just as tradeable as the impulses.
Here is everything you need to know about the double corrective pattern and how to use it in live markets.
What Is A Double Corrective Pattern?
A double corrective pattern happens when a single correction is not enough to balance market momentum.
Instead of one clean ABC move, the price forms two separate corrective structures joined together by a small linking wave. The result is a longer, more complex pullback that catches many traders off guard.
In Elliott Wave terms, this is called a double correction Elliott Wave, and it is labeled as W X Y.
This structure is one of the most vital entries on any Elliott wave cheat sheet because it defines the difference between a simple pullback and a complex, time-consuming range.
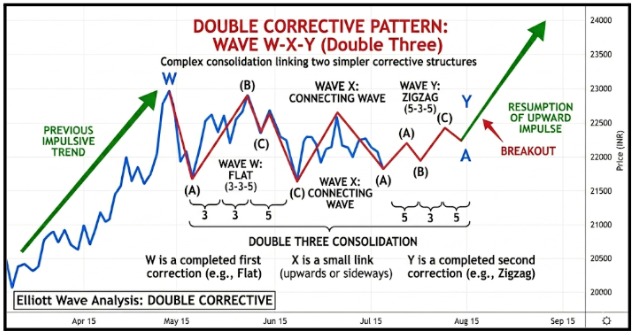
Here is the basic structure:
| Wave | Role |
| W | First corrective structure |
| X | Small connecting wave |
| Y | Second corrective structure |
One important rule to remember here is that Wave W and Wave Y are not identical in what they can be.
Note: Wave W can be a zigzag or flat, but NOT a triangle. Only Wave Y can be a triangle in a double corrective pattern.
The X wave is the connector between the two corrections, and it has three defining characteristics that traders must know:
- Direction: It moves opposite to the main correction. So if Wave W moved downward in an uptrend correction, Wave X will move upward.
- Size: It is typically smaller than both Wave W and Wave Y. Its length and depth often resemble a Wave B subdivision found within Wave W or Wave Y itself.
- Opportunity: It is the most important entry point in the entire pattern. Traders who correctly identify where Wave X ends can enter in the direction of Wave Y and ride the second corrective leg with a clearly defined risk.
The Core Rule Of Double Corrective Patterns
The single most important rule under Elliott Wave theory is this: Corrective waves always move in three-wave structures, never five.
This means both Wave W and Wave Y must subdivide into corrective formations internally. If you spot a five-wave impulsive move inside either W or Y, you are most likely mislabeling the pattern.
This is one of the most common mistakes traders make. A developing impulse wave can look deceptively similar to a complex correction on a live chart.
Textbook examples are clean, but real markets are messier. This is where experience and patience matter more than anything else.
Important Rules
- Wave X cannot break the origin point of Wave W
- Wave Y typically travels a distance equal to Wave W, with extensions beyond that being less common
- The overall structure must remain corrective throughout, never impulsive
Now that you understand the basic structure and rules, the next natural question is, why does the market form this pattern in the first place? Let us look at the psychology and market conditions behind it.
Why Markets Form A Double Correction Elliot Wave?
Corrections exist to balance excess emotion. After a strong trend, traders take profits. New traders hesitate.
Institutions adjust positions. Sometimes, one correction clears the pressure. Sometimes it does not. When momentum remains strong in the larger trend, price struggles to reverse fully.
Instead, it stretches the correction sideways or deeper. That is when a double corrective pattern appears.
Identifying the various corrective wave types is essential here, as the market often switches from a sharp move to a sideways one to exhaust traders.
Think of it like a negotiation between bulls and bears. The first round ends. No clear winner. So they go again.
You will often see this in:
- Strong trending markets
- Forex pairs during high volatility
- Indices after major news
- Crypto during consolidation phases
WXY Vs ABC in a Double Corrective Pattern
Many traders confuse a WXY correction with a simple ABC zigzag because both appear as three-leg movements on a chart. The real difference lies in the internal wave structure.
A WXY pattern forms a 3-3-3 structure, meaning each leg is corrective. It combines two corrective patterns, which is why it is often called a double three or double correction.
Wave W, X, and Y can include patterns like zigzags, flats, triangles, or even complex combinations. In contrast, a zigzag correction follows a 5-3-5 structure, where Waves A and C are impulsive moves with five sub-waves.
Recognizing this distinction helps traders avoid mislabeling patterns during live chart analysis.
| Pattern | Internal Structure | Key Feature |
| WXY Correction | 3-3-3 | All waves are corrective combinations |
| ABC Zigzag | 5-3-5 | Waves A and C are impulsive |
Structure Of The Elliott Double Combo Pattern
The Elliott Double Combo Pattern refers to specific combinations of two corrective structures.
The most common combinations are zigzag followed by a flat, zigzag followed by a zigzag, and flat followed by a triangle.
A triangle almost exclusively appears in Wave Y and is rarely seen in Wave W.
1. Basic Labeling in Double Corrective Pattern
Each combination follows the same W-X-Y labeling.
In rare cases where three corrections link together, the pattern extends to W-X-Y-X-Z, though this is uncommon and harder to identify in live markets
Chart Example:
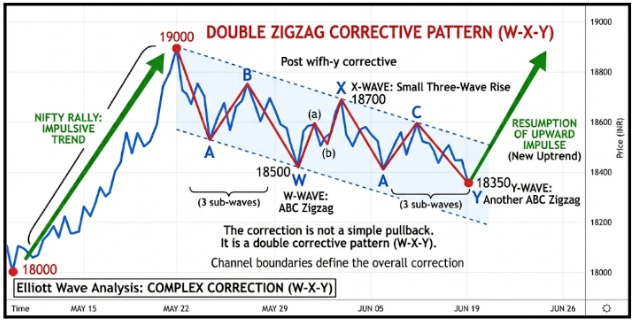
Nifty rallies from 18000 to 19000.
Then:
- Price falls to 18500 in an ABC zigzag. That is W.
- Price rises to 18700 in a small three-wave move. That is X.
- Price drops again to 18350 in another ABC structure. That is Y.
The correction is not a simple pullback. It is a double corrective pattern.
If you bought at 18500 expecting trend continuation, you probably felt early. That second leg Y tests patience.
2. Fibonacci Targets: Estimating Where Wave Y Ends
Understanding the Fibonacci relationship in a WXY correction helps traders estimate where the second corrective leg may finish.
In most double corrective patterns, Wave Y tends to mirror the length of Wave W.
Typical Fibonacci guidelines used by traders are:
- Wave Y: 100 percent of Wave W
- Wave Y: 123.6 percent of Wave W
- Rarely extends beyond 161.8 percent of Wave W
These relationships give a practical price target once Wave X is complete.
Example:
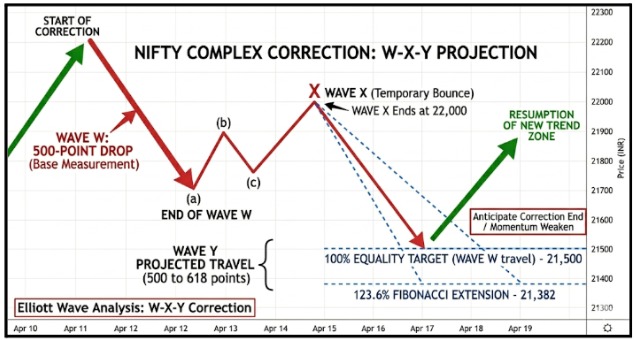
Wave W falls 500 points during a correction. After a bounce forming Wave X, the next leg, Wave Y, is likely to travel a similar distance.
| Wave | Example Movement | Fibonacci Target |
| W | 500-point drop | Base measurement |
| X | Temporary bounce | Connector wave |
| Y | 500 to 618 points | 100% to 123.6% of W |
If Wave X ends at 22,000 on Nifty, traders may project:
- 21,500 as the 100 percent equality target.
- 21,382 as the 123.6 percent Fibonacci extension.
These projected levels help traders anticipate where the correction might complete. Once Wave Y approaches these zones and momentum weakens, many traders start preparing for the next trend move.
Double Top Pattern Vs Double Corrective Pattern
Now, let us clear the confusion.
A Double top pattern is a classical chart pattern. It forms a resistance and signals a potential reversal.
A double corrective pattern is part of the Elliott Wave structure within a trend.
Here is a comparison:
| Feature | Double Top Pattern | Double Corrective Pattern |
| Purpose | Reversal signal | Continuation correction |
| Structure | Two peaks at a similar level | W X Y corrective waves |
| Psychology | Distribution at highs | Extended consolidation |
| Context | Often at the trend end | Often, within a larger trend |
They can look similar on a chart. But the intention is different.
A double top aims to reverse the trend. A double corrective pattern prepares the price for continuation.
Context decides everything.
How To Trade The Double Corrective Pattern?
A double corrective pattern (W X Y) appears when the market fails to finish a correction with a single structure and instead links two corrective patterns together.
For traders, the goal is not to trade the messy middle of the correction but to position for the trend continuation that usually follows the pattern.
Below are two common trading approaches used by Elliott Wave traders.
Entry Method 1: Trade From The End Of Wave X
This is the more aggressive and widely used method because it offers a better risk-reward setup.
- Entry Point: Near the end of Wave X, when price retests the trend direction before Wave Y begins.
- Logic: Wave X often creates a temporary return toward the trend, giving traders an early entry before the final corrective wave develops.
- Stop Loss: Below the origin of Wave W. If the price breaks that level, the double correction is likely invalid.
- Target: The previous impulse high or low, which is the level from which Wave W originally started.
This method allows traders to enter early while the correction is still developing, but it requires confidence in the wave count.
Entry Method 2: Conservative Entry After Wave Y Completion
Traders who prefer confirmation usually wait until the entire correction finishes.
- Entry Point: After Wave Y completes and price shows a reversal signal such as a strong candle, trendline break, or momentum shift.
- Stop Loss: Below the end of Wave Y or slightly below the origin of Wave W.
- Target: The prior impulse high or low, signalling the continuation of the larger trend.
Practical Example:
Let us talk practically.
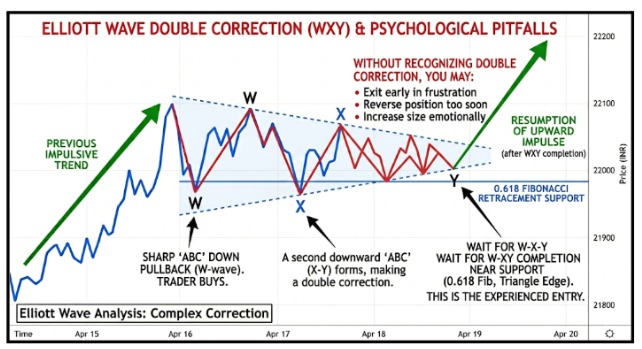
You are trading Bank Nifty in an uptrend. Price pulls back sharply. You spot an ABC correction. You buy.
Then the price forms another ABC down.
If you do not recognize a double correction Elliott wave, you may:
- Exit early in frustration
- Reverse position too soon
- Increase size emotionally
Instead, experienced traders wait for W X Y completion near support or Fibonacci levels like 0.618 retracement.
Risk management matters here:
- Stop below the Y termination
- Position size is smaller during corrections
- Wait for a bullish confirmation candle
Corrections are messy. That is normal.
Practical Tips For Traders
Here are simple guidelines:
- Do not trade the first ABC blindly.
- Look for weak momentum in the second leg.
- Use RSI divergence for Y confirmation.
- Combine with support zones.
- Avoid forcing wave counts.
TradingView charts help with labeling. But tools do not replace patience.
Markets reward discipline, not clever counting.
Conclusion
A double corrective pattern may look messy at first, but it follows a clear structure once you understand the W X Y sequence.
Instead of assuming every pullback ends after one ABC move, experienced traders stay patient and wait for the full correction to complete.
Recognizing this pattern helps avoid early entries and emotional decisions.
In real trading, clarity about corrections often means better timing, better risk control, and more confident trend participation.
Want to truly master the Double Corrective Pattern and trade it with confidence?
Join our Elliott wave classes for detailed, step-by-step sessions from real market experts.
FAQs
Q1: Is A Double Corrective Pattern Bullish Or Bearish?
Ans: It depends entirely on the larger trend. In an uptrend, Wave W and Y move downward as corrections, and the pattern sets up a bullish continuation.
In a downtrend, both waves move upward as bounces and support further downside. Always identify the larger trend first before assigning a directional bias.
Q2: How is the Double Correction Elliot Wave Different From A Simple ABC?
Ans: A simple ABC zigzag follows a 5-3-5 structure where Waves A and C are impulsive. A double correction follows a 3-3-3 structure where every leg is corrective.
It also includes a linking X wave connecting two separate corrective structures, making it longer and more complex. Both can look like three-legged moves on a chart, so checking the internal wave count is essential.
Q3: Can A Double Top Pattern Be Part Of A Double Corrective Pattern?
Yes, visually, it can resemble one. But a double top is a reversal pattern, while a double corrective pattern is typically a continuation structure within Elliott Wave theory.
Before investing capital, invest your time in learning Stock Market.
Fill in the basic details below and a callback will be arranged for more information:


