

Markets move in waves. Not random chaos. Not pure guesswork. When traders first see price charts behave like rhythm rather than noise, something clicks. The Elliott wave cheat sheet revolves around that idea.
This is based on a notion developed by Ralph Nelson Elliott, who observed that crowd psychology generates price cycles that repeat themselves.
Fear pushes markets down. Optimism lifts them again. The cycle repeats.
But reading wave structures on a live chart can feel messy. Waves overlap, corrections stretch longer than expected, and trends sometimes trick the eye.
That is the reason why traders need to read Elliott wave charts with a cheat sheet close by.
When going through charts, it acts as a quick reference manual.
Think of it as a map. It is not flawless but stands in handy when dealing in unstable markets.
Understanding The Core Of Elliott Wave Theory
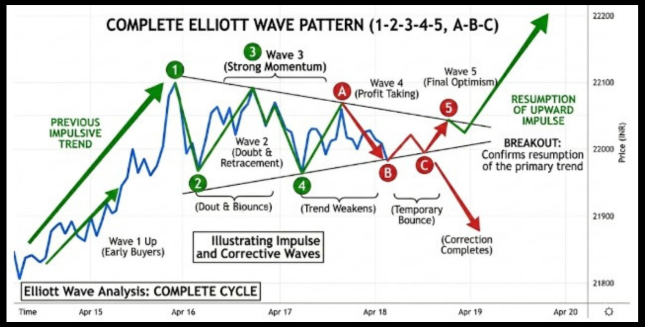
The theory rests on a simple observation. Market trends move in five waves forward and three waves back.
The forward movement shows strong market sentiment. The pullback reflects profit booking and hesitation.
| Wave Type | Direction | Market Behavior |
| Wave 1 | Up | Early buyers enter |
| Wave 2 | Down | Traders doubt the move |
| Wave 3 | Up | Strong momentum appears |
| Wave 4 | Down | Profit taking begins |
| Wave 5 | Up | Final push of optimism |
| Wave A | Down | Trend weakens |
| Wave B | Up | Temporary bounce |
| Wave C | Down | Correction completes |
Short version. Five impulse waves. Three corrective waves.
This 8-wave complete cycle then becomes Wave 1 of an even larger cycle. This is called the fractal nature of Elliott Waves; the same pattern repeats on every timeframe.
Elliott Wave Theory Cheat Sheet for Beginners
Reading waves becomes easier when a few rules stay fixed. Traders often write them at the top of their cheat sheet.
These principles align closely with the ABC correction rules of Elliott wave, which explain how corrective waves unfold after a five-wave impulse move.
The three golden rules:
| Rule | Explanation |
| Wave 2 Never Retraces 100% Of Wave 1 | If it does, the count is wrong |
| Wave 3 cannot Be The Shortest | It is usually the strongest wave |
| Wave 4 Does Not Enter Wave 1 Territory | Except in diagonal patterns |
Simple rules. Yet they prevent many bad trades.
Quick wave characteristics:
- Wave 1: Early trend signal. Often ignored by most traders.
- Wave 2: Sharp pullback. Many believe the trend failed.
- Wave 3: Strongest and longest wave. Volume expands.
- Wave 4: Sideways movement. Momentum slows.
- Wave 5: Final trend push. Sentiment becomes extreme.
Professional traders focus heavily on Wave 3 because it often delivers the biggest move.
Motive Waves Vs Corrective Waves Cheat Sheet
Traders need to learn the distinction between corrective waves and motive waves before learning how to comprehend advanced Elliott Wave structures.
Motive Waves: These waves push the market forward in the direction of the primary trend.
- Usually strong and fast price moves.
- Contain five smaller waves inside the structure.
- Waves 1, 3, and 5 are motive waves in a typical impulse pattern.
- Wave 3 often carries the strongest momentum and volume.
Corrective Waves: Corrective waves represent the market catching its breath after a strong move.
- Move against the main trend.
- Develop in three-wave structures such as zigzags, flats, or triangles.
- Include Wave 2, Wave 4, and the A B C correction.
- Price movement is often choppy and sideways.
To put it simply, the wave of motives moves the trend, and the corrective waves stop or reverse a trend.
A trending market proceeds with a series of motive waves and, in between, withdraws with corrective waves, and then again on a forward, stronger motive wave.
The simplest rule to remember is this: If a move has five sub-waves, it is motive. If it has three sub-waves, it is corrective.
Once traders learn to identify these 3-wave and 5-wave structures, they already understand the core foundation of Elliott Wave analysis.
Quick Cheat Sheet For Traders:
| Type | Waves | Direction | Structure |
| Motive (Impulse) Pattern | 1, 3, 5 | With the trend | Always 5 sub-waves |
| Corrective Pattern | Zigzag: 5-3-5 | Against the trend | 7 subwaves |
| Flag: 3-3-5 | 11 subwaves | ||
| Triangle: A-B-C-D-E | 5 subwaves (each dividing further) | ||
| Complex Correction | Depends upon subwaves |
1. Zigzag Correction Pattern Cheat Sheet
A zigzag correction is a sharp countertrend move that usually appears when the market quickly retraces part of a strong trend.
In an Elliott wave pattern cheat sheet, it follows a 5-3-5 structure and often signals a fast but temporary pullback before the trend continues.
| Feature | Description |
| Structure | 5-3-5 |
| Behavior | Sharp correction |
| Market Mood | Panic selling |
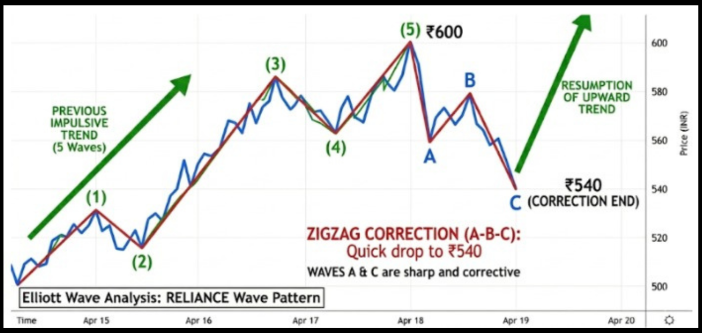
RELIANCE rises from ₹500 to ₹600 in five waves. Then the price drops quickly to ₹540 in a zigzag correction before the trend resumes.
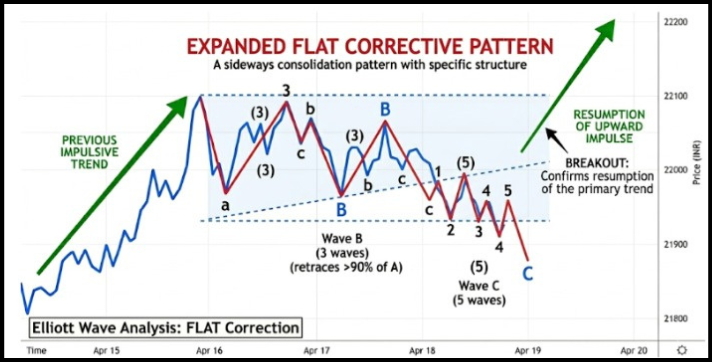
2. Flat Correction Pattern Cheat Sheet
A flat correction is a sideways price pattern that appears during a market pause rather than a sharp reversal.
It typically follows a 3-3-5 wave structure, showing that buyers and sellers are temporarily balanced before the next trend move begins.
| Feature | Description |
| Structure | 3-3-5 |
| Behavior | Sideways consolidation |
| Market Mood | Uncertainty |
3. Triangle Pattern Cheat Sheet
A triangle pattern forms when price moves within a narrowing range, creating a series of lower highs and higher lows.
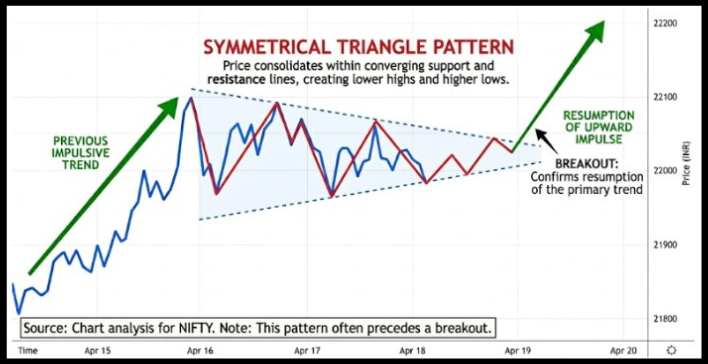
In an Elliott wave pattern cheat sheet, this triangle pattern of Elliott wave structure usually appears during consolidation before the market makes its next strong move.
| Feature | Description |
| Structure | A B C D E waves |
| Behavior | Contracting range |
| Market Mood | Market waiting for a breakout |
Triangles often appear in Wave 4 or Wave B.
Once the pattern completes, markets usually move strongly in the previous trend direction.
4. Diagonal Waves Pattern Cheat Sheet
A diagonal wave in Elliott Wave theory is a special type of motive pattern, but it behaves differently from a normal impulse.
It appears at specific points in the wave structure and often forms a wedge-shaped pattern. One unique feature is that Wave 4 usually overlaps Wave 1, which normally breaks a key Elliott rule.
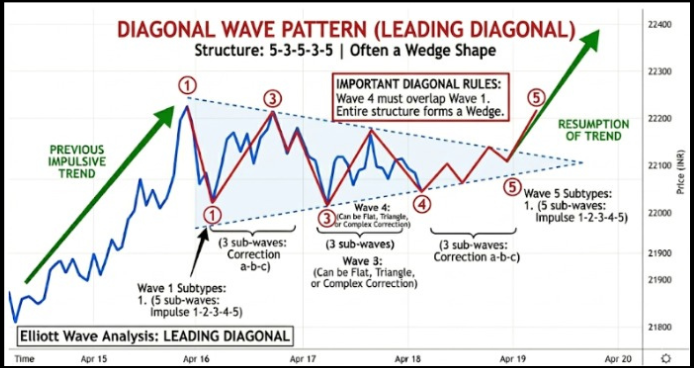
This overlap often confuses beginners and leads them to discard correct wave counts. Understanding diagonals helps traders recognize valid patterns during trend beginnings or endings.
Two Common Types:
- Leading Diagonal of Elliot Wave: Occurs in either Wave 1 or Wave A. It is shaped like a wedge. A Leading Diagonal in Wave 1 can subdivide into either 5-3-5-3-5 or 3-3-3-3-3 internally. A Leading Diagonal in Wave A almost always subdivides into 3-3-3-3-3.
The internal structure depends on where in the wave count the diagonal appears; there is no single fixed rule that applies to all cases. - Ending Diagonal of Elliot Wave: It is observed in Wave 5 or Wave C and is usually an indication that the trend is near exhaustion. An Ending Diagonal in Wave 5 always subdivides into 3-3-3-3-3 internally. However, a rare variant, an Ending Diagonal appearing in Wave C, can subdivide into 5-3-5-3-5. Both are valid.
Knowing which variant you are looking at changes how you count the internal waves.
Practical Tip:
- If Wave 4 overlaps Wave 1, don’t discard the wave count immediately. Check whether a diagonal pattern may be forming before restarting the analysis.
Real Trading Scenario Using An Elliott Wave Cheat Sheet
Consider this chart for Reliance Industries. A trader studies the daily chart and spots this sequence:
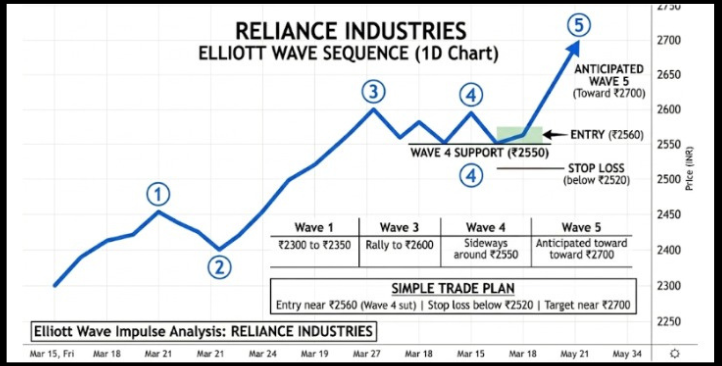
| Wave | Price Movement |
| Wave 1 | ₹2300 to ₹2400 |
| Wave 2 | Pullback to ₹2350 |
| Wave 3 | Rally to ₹2600 |
| Wave 4 | Sideways around ₹2550 |
The trader expects Wave 5 to push toward ₹2700.
A simple trade plan might look like this:
- Entry near ₹2560 during Wave 4 support.
- Stop loss below ₹2520.
- Target near ₹2700.
Risk remains controlled. The trade follows the structure suggested by the cheat sheet.
Fibonacci Levels for Elliott Wave
Fibonacci ratios play a key role in Elliott Wave analysis because they help traders estimate how far a wave might extend or retrace.
Since market movements often follow natural mathematical relationships, these levels provide useful reference points for identifying potential support, resistance, and wave targets.
| Wave | Fibonacci Level to Watch |
| Wave 2 retracement | 50%–61.8% of Wave 1 |
| Wave 3 target | 161.8% of Wave 1 (from Wave 2 end) |
| Wave 4 retracement | 23.6%–38.2% of Wave 3 |
| Wave 5 target | Equal to Wave 1, or 61.8% of Wave 1–3 distance |
| Wave C target | 100%–161.8% of Wave A |
Traders often analyze these projections to estimate the Elliott wave theory 5 length, which helps determine where the final impulse wave might complete before a larger correction begins.
The most common Fibonacci expansions used in Elliott Wave include 100%, 161.8%, and 261.8%, with 161.8% being the most significant, the Golden Ratio.
Elliott Wave Pattern Rules
Even experienced traders admit something quietly.
Wave counts can be wrong.
That is why risk management matters more than pattern recognition.
Simple risk guidelines:
- Always use stop losses.
- Confirm waves with volume or indicators.
- Avoid forcing wave counts.
- Combine Elliott waves with tools like Fibonacci retracement.
- Focus on Wave 3 setups for better probability.
A useful trick many traders use:
Wave 1 is frequently retraced by Wave 2 to 50% to 61.8%.
That connection is based on Fibonacci mathematics, which is compatible with the Elliott analysis.
Elliott Wave Guidelines Every Trader Should Know
The above rules are requirements that must be followed, while the following guidelines have around 80–90% reliability and provide predictive power.
| Guideline | What It Means |
| Wave 3 usually extends | Wave 3 is most often the longest wave End of Wave 2 + (161.8% × length of Wave 1) target 161.8% of Wave 1 |
| Alternation | If Wave 2 is sharp (zigzag), Wave 4 will be sideways (flat or triangle) |
| Wave 5 equality | When Wave 3 extends, Wave 5 often equals Wave 1 in length |
| Wave 2 depth | Wave 2 typically retraces 50%–61.8% of Wave 1 |
| Wave 4 depth | Wave 4 typically retraces 23.6%–38.2% of Wave 3 — shallower than Wave 2 |
The Guideline of Alternation states that the forms of Wave 2 and Wave 4 will alternate; if Wave 2 is simple, Wave 4 will be complex, and vice versa.
Conclusion
Charts rarely follow the textbook. Waves stretch further than expected. Corrections turn messy.
But the underlying psychology never changes. Markets oscillate between fear and confidence, and that emotional rhythm is what creates wave structures in the first place.
Experienced traders do not chase perfect wave counts. They read structure, manage risk, and stay flexible when the market does not cooperate.
So, if you want to master these patterns in real-time, join our Elliott Wave classes to simplify these calculations for successful trading.
FAQs
Q1: What do traders use to validate an Elliott wave count on a live chart?
Ans: Several traders verify a wave count by merging the cheat sheet with the application using such tools as Fibonacci retracement, trendlines, and volume spikes.
When Wave 3 grows and keeps its vibration, and Wave 4 remains above Wave 1, the figure tends to be more favorable.
Q2: Are Elliott Waves applicable to short time periods, such as 5 Minute charts?
Ans: Yes, the cheat sheet can be used in the case of the intraday chart since market psychology is replicated over time.
But the smaller periods of time are very likely to give noisy price action, traders tend to verify the pattern on a larger time frame, so that they can take the trades.
Q3: What makes some Elliott Wave Counts impractical in Real Trading?
Ans: Wave counts cannot work when traders impose patterns on random prices.
The Elliott wave cheat sheet is also viewed as a guide and not a strict prediction method by professional traders, who sometimes use long or overlapping waves to form the markets.
Before investing capital, invest your time in learning Stock Market.
Fill in the basic details below and a callback will be arranged for more information:


