

Knowing what a moving average is and knowing which EMA variation to use are two very different things, and the difference shows up directly in your trades.
Traders who want to strike a balance between responsiveness and smoothness in their charts frequently argue the Double EMA vs Triple EMA.
DEMA reacts faster than a standard EMA. TEMA reacts even faster than DEMA. But that speed comes at a cost: more false signals. Your trade accuracy can be significantly improved by knowing when to employ each.
Let’s understand this concept in simple terms.
What Is Double EMA and Triple EMA?
Before drawing any comparisons, it is important to understand what these indicators truly represent. Both indicators are built to cut the lag that standard EMAs carry, so traders can catch trend changes sooner.
When looking at Double EMA vs EMA, the primary advantage of the DEMA is that it uses a more complex calculation to stay closer to the current price than a standard EMA ever could.
- The Double Exponential Moving Average (DEMA) is calculated by doubling the EMA value and then subtracting the EMA of that EMA, which reduces latency, rather than just “applying an EMA twice.”
This specific moving average calculation keeps signals somewhat dependable while allowing for a speedier response to price fluctuations.
- The Triple Exponential Moving Average (TEMA) takes this idea even further. It generates quicker signals than DEMA by subtracting combinations of EMAs of EMAs and tripling the EMA value.
But this faster speed comes at a cost: TEMA can generate more false signals in erratic or sideways markets; it is best suited for traders looking for rapid trend identification or short-term setups.
DEMA is fast and responsive but still somewhat stable. TEMA is faster and more sensitive, useful for early trend signals, but it needs extra caution in choppy or sideways markets.
Although they both serve somewhat distinct trading styles and market scenarios, they both outperform the typical EMA.
Double EMA vs Triple EMA Formula
Understanding how these formulas work helps you choose types of technical indicators that fit your trading style.
Depending on your preference for cleaner trends or faster signals, the calculations show how each approach strikes a compromise between speed and smoothness.
Double EMA formula:
DEMA = 2 * EMA (price, period) – EMA (EMA (price, period), period)
Step-By-Step Calculation For DEMA:
- Step 1: Calculate EMA of price → call it EMA1
- Step 2: Calculate EMA of EMA1 → call it EMA2 (this has more lag)
- Step 3: DEMA = (2 × EMA1) − EMA2. Subtracting EMA2 cancels out the extra lag, making DEMA faster
Triple EMA formula:
TEMA = 3 * EMA (price, period) – 3 * EMA (EMA (price, period), period) + EMA (EMA (EMA (price, period), period), period)
Step-By-Step Calculation For TEMA:
- Uses the same logic but adds a third layer: EMA3 = EMA of EMA2
- TEMA = (3 × EMA1) − (3 × EMA2) + EMA3
- Each extra layer pulls the line closer to the price, reducing lag further
TEMA cuts lag further than DEMA by adding that third layer of calculation.
In extremely quick markets, traders who use double ema vs triple ema formula calculators frequently observe that TEMA produces smoother signals but may somewhat delay reactions compared to DEMA.
Difference Between Double EMA and Triple EMA
The real difference between DEMA and TEMA isn’t just in the math; it’s in how each one reads the market.
Traders frequently observe that, whereas Triple EMA offers smoother signals that filter out market noise, Double EMA responds to abrupt price fluctuations more quickly.
|
Feature |
DEMA | TEMA |
| Calculation | (2 × EMA1) − EMA2 |
(3 × EMA1) − (3 × EMA2) + EMA3 |
|
Responsiveness |
Fast | Faster |
| Lag | Less than EMA |
Least of all three |
|
Signal Timing |
Earlier than EMA | Earlier than DEMA |
| False Signals in Choppy Markets | Moderate |
High |
|
Best For |
Day traders, trending markets | Aggressive scalpers, fast-moving trends |
| Risk of Whipsaws | Moderate |
Higher |
For instance, a TEMA crossing in Bank Nifty futures may lead to a purchase at 42,340, while a DEMA crossover at 42,350 would confirm the trend a little later.
When timing their positions, traders must weigh the trade-off between faster TEMA signals, which allow an earlier entrance, and DEMA signals, which offer a more measured confirmation.
Double and Triple Exponential Moving Average in Practice
In real markets, these aren’t just lines on a chart. Traders use them to decide when to enter, when to exit, and when to stay out entirely.
DEMA Trading Example:
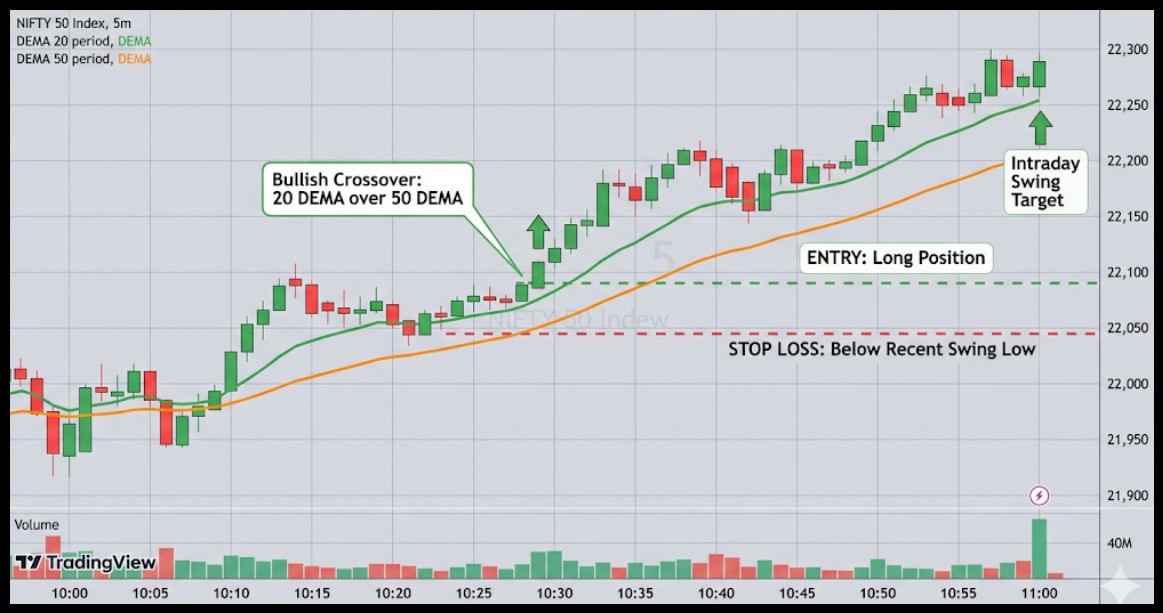
Traders may instantly open a long position with a stop loss below the most recent swing low if the Nifty creates a bullish crossover of the 20-period DEMA over the 50-period DEMA.
This is effective for quick intraday swings.
TEMA Trading Example:
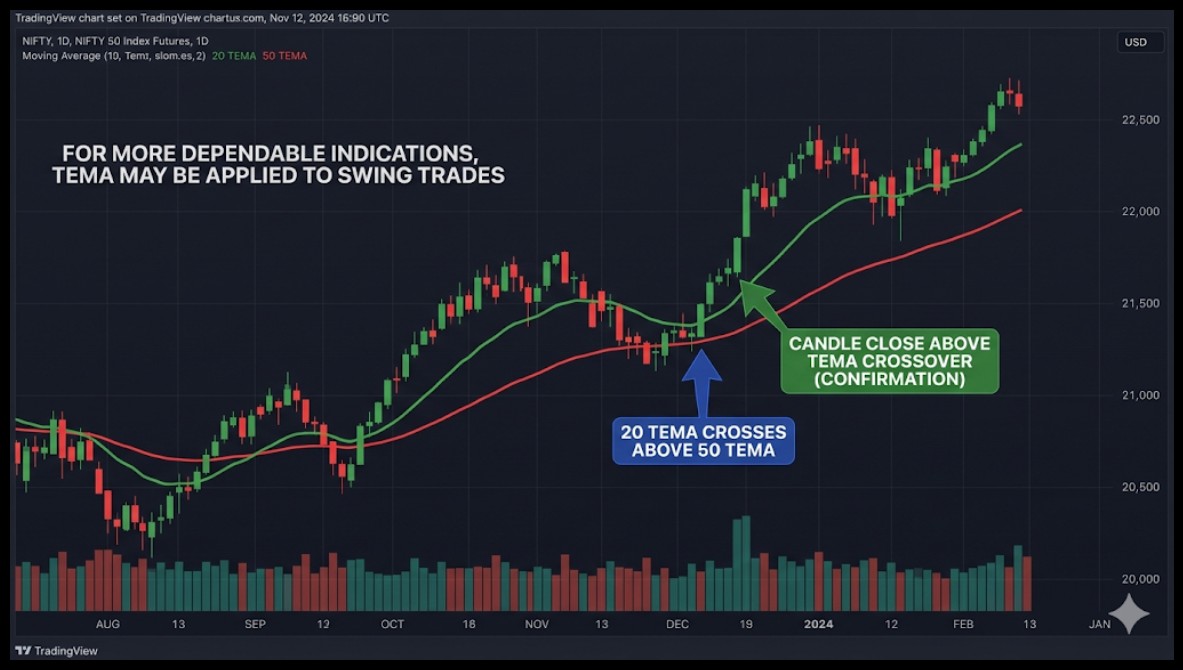
For more dependable indications, TEMA may be applied to swing trades.
When the 20-period TEMA crosses over the 50-period TEMA, traders usually wait for a candle to close above the TEMA crossover for additional confirmation.
Depending on the market and timeframe, traders can choose between faster early signals with DEMA or smoother confirmation with TEMA.
How to Use Double and Triple EMA to Time Your Trades?
The distinction between double and triple EMA becomes useful when it comes to timing transactions.
This method assists you in determining whether to wait for a more seamless confirmation to minimise false movements or enter early with a faster signal.
- Dual EMA Strategy: Make rapid trades by using both short-term and long-term DEMA crossovers. Ideal for day trading, where speed is essential.
- Triple EMA Strategy: To validate signals, combine TEMA with a trend filter, such as a 200-period SMA. Perfect for position or swing trades when your risk-reward ratio might be negatively impacted by misleading signals.
Example:
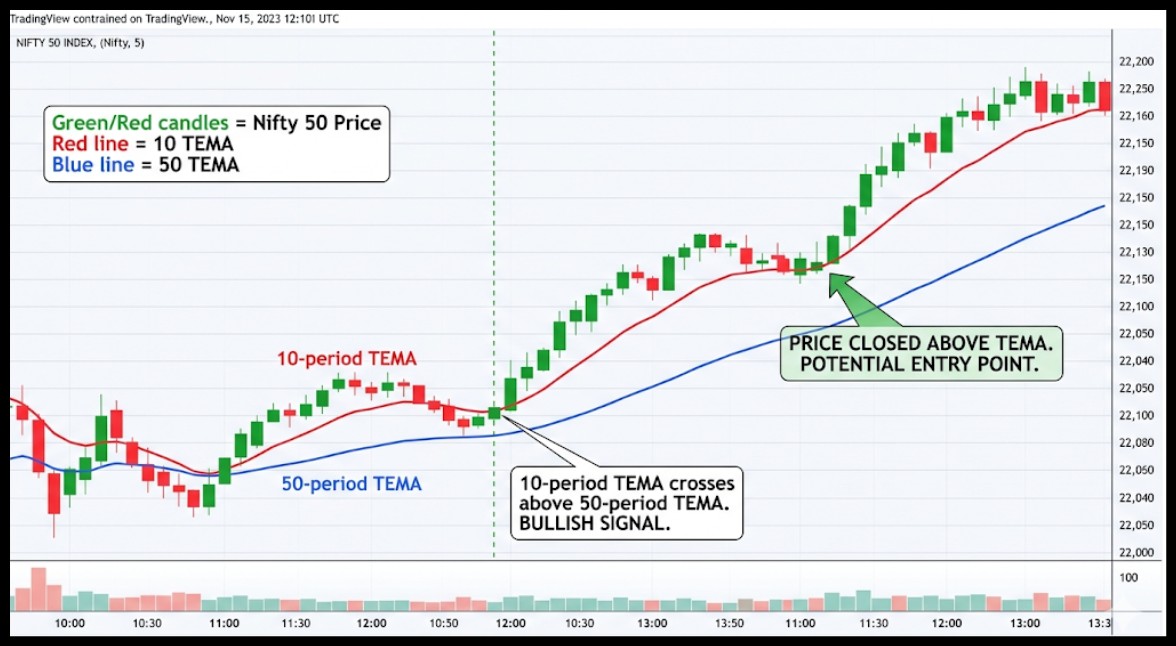
Nifty is trending upwards, and the 10-period TEMA crosses above 5the 0-period TEMA.
Traders may enter only after the price closes above TEMA, reducing the risk of whipsaws during intraday reversals.
Double EMA vs Triple EMA Calculator
Traders often rely on calculators or trading platforms to test these indicators. A double EMA vs triple EMA calculator allows users to:
- Compare signals generated by DEMA and TEMA on the same chart
- Test historical price data for success rate evaluation
- Adjust periods to find the optimal setup for their trading style
In addition to helping traders backtest strategies, analyse signals, and optimize their entry and exits using actual data, these tools are helpful for anybody asking, “Which moving average combination works best for my timeframe?”
Which is The Most Profitable Moving Average Crossover?
Not every moving average crossing is the same when it comes to trading. Finding the most lucrative moving average crossover enables traders to minimise false signals while effectively capturing trends.
In terms of profitability:
- Because DEMA responds more quickly, it performs better in short-term, high-volatility situations.
- In trending markets where false breakouts are more frequent, TEMA often performs better, assisting traders in capturing persistent movements.
A 10 DEMA and 50 DEMA crossing on a 5-min Nifty or Bank Nifty chart is a popular and useful starting point for the majority of Indian intraday traders.
TEMA crossings with identical periods will fire one or two candles ahead of schedule, but further volume confirmation is needed.
When Does Each Indicator Fail?
Even while TEMA and DEMA are potent, it’s critical to know when to avoid them. You may avoid expensive blunders in unpredictable markets by being aware of their shortcomings.
- When both DEMA lines flatten, there are many false crossings, which is why DEMA fails in sideways markets.
- DEMA may overreact on shorter timescales, such as one-minute or five-minute charts, which might result in overtrading.
- In turbulent times, TEMA fails because prices frequently cross TEMA more frequently than DEMA, creating erroneous signals.
- Practical rule: Ignore both indicators since the trend is weak if the ADX is less than 20.
Traders can prevent needless losses and enhance overall strategy discipline by being aware of these dangers.
Additionally, it guarantees that you don’t chase every small market move and instead place trades with greater probability setups.
Which EMA Should You Choose?
The choice between DEMA and TEMA is simpler than it looks; it mostly comes down to your trading style and the market conditions.
The choice ultimately depends on your trading style:
- Day Traders: DEMA is preferable for capturing quick intraday moves.
- Swing Traders: TEMA provides better reliability over multi-day trends.
- Experimentation: The best method to determine which fits your risk tolerance and plan is to test using a double EMA vs triple EMA calculator on historical charts.
Think of DEMA as a quick-response lens and TEMA as a smoothing lens; both are useful, just for different moments.
Both can improve trade timing and reduce emotional decision-making when applied appropriately.
Final Thoughts
Understanding the difference between DEMA and TEMA gives traders a sharper toolkit, one that works across timeframes and helps manage risk more precisely.
- DEMA = sharper, quicker signals that are better for intraday
- TEMA is more dependable, smoother, and perfect for swing trades.
Tailoring plans to your market and timeline is made easier by knowing the distinction between double and triple ema.
The likelihood of success is increased when they are combined with trend filters or other indicators.
Level up your trading skills. Join our technical analysis classes and learn how to use these indicators on real market charts with practical clarity.
FAQs
Q1: Is Double EMA better than Triple EMA?
Ans: Your trading technique will determine this. While TEMA is smoother and more dependable over longer trends, DEMA is faster.
Q2: Can I use both DEMA and TEMA together?
Ans: Yes, using DEMA for early entries and TEMA for confirmation can improve trade timing and reduce false signals.
Q3: Do Double and Triple EMA work for all timeframes?
Ans: They do, but DEMA suits fast intraday charts, while TEMA is preferable for daily or swing trading charts.
Before investing capital, invest your time in learning Stock Market.
Fill in the basic details below and a callback will be arranged for more information:


