

Two moving averages, one key difference. And once you see it, you’ll never look at a chart the same way.
Moving averages are the bread and butter of technical trading. But when you start comparing Double EMA vs EMA, things get genuinely interesting.
Traders constantly debate whether a standard EMA gets the job done or whether the added complexity of a Double EMA is actually worth it.
In this blog, we break down the key differences, real-world uses, and much more so that you know exactly what works for you.
What Is EMA?
Let’s review the fundamentals before comparing. The Exponential Moving Average (EMA) is sensitive to the state of the market since it places greater emphasis on recent price activity. It is used by traders to:
- Identify trends quickly
- Spot potential reversals early
- Confirm support and resistance zones
For instance:
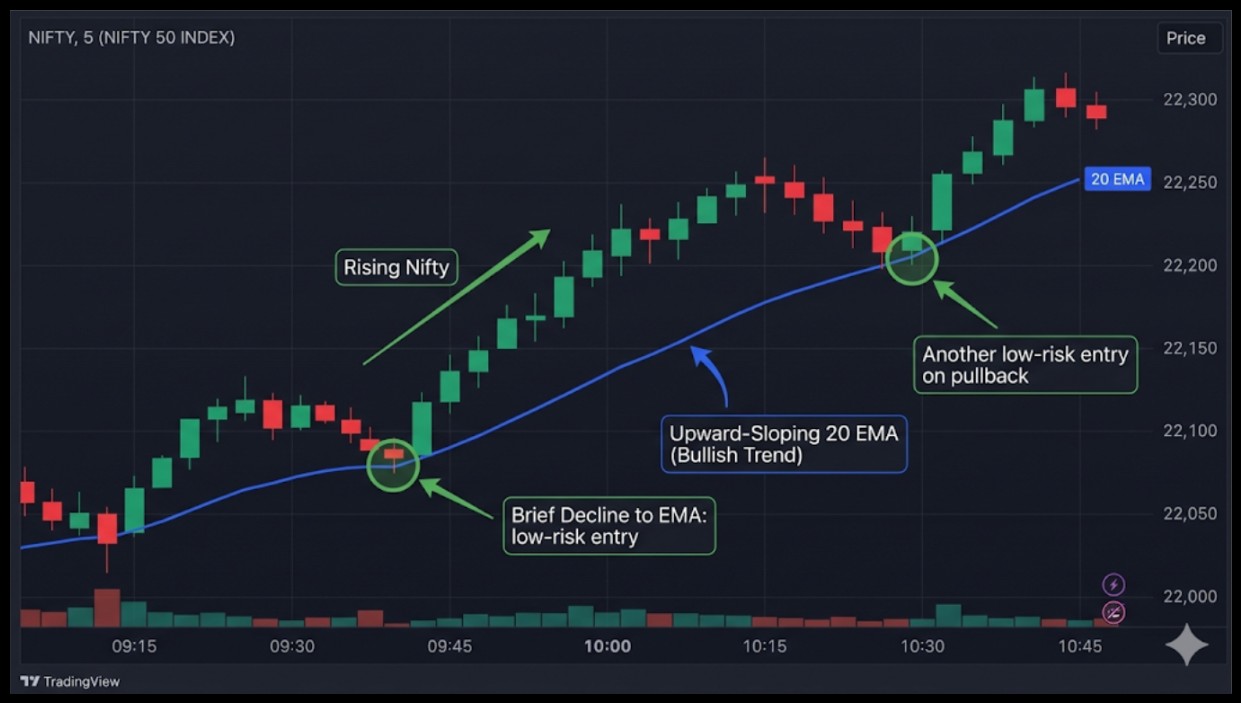
Many traders view a consistently rising Nifty with an upward-sloping 20 EMA as a bullish trend. A low-risk entry opportunity may be provided by brief declines in the EMA.
What Is Double EMA (DEMA)?
The Double EMA, or DEMA, takes the EMA a step further. It was introduced in January 1994 by Patrick G. Mulloy in the “Technical Analysis of Stocks & Commodities” magazine, and is designed to reduce lag by using two EMAs in its calculation:
- EMA of the price
- EMA of the EMA
The DEMA formula:
EMA1 = EMA of price, EMA2 = EMA of EMA1, and DEMA = (2 × EMA1) − EMA2.
Here’s a simple way to understand how DEMA is calculated, breaking it down step by step for clarity:
- Step 1: Calculate a standard EMA on price (this is EMA1)
- Step 2: Calculate another EMA on EMA1 (this is EMA2, and it has even more lag)
- Step 3: DEMA = (2 × EMA1) − EMA2. The subtraction cancels out the extra lag
This effectively smooths the line while responding faster than a traditional EMA. The idea is to capture trends sooner and reduce false signals.
On a DEMA chart, price crossovers occur earlier, giving traders more timely signals.
For instance:
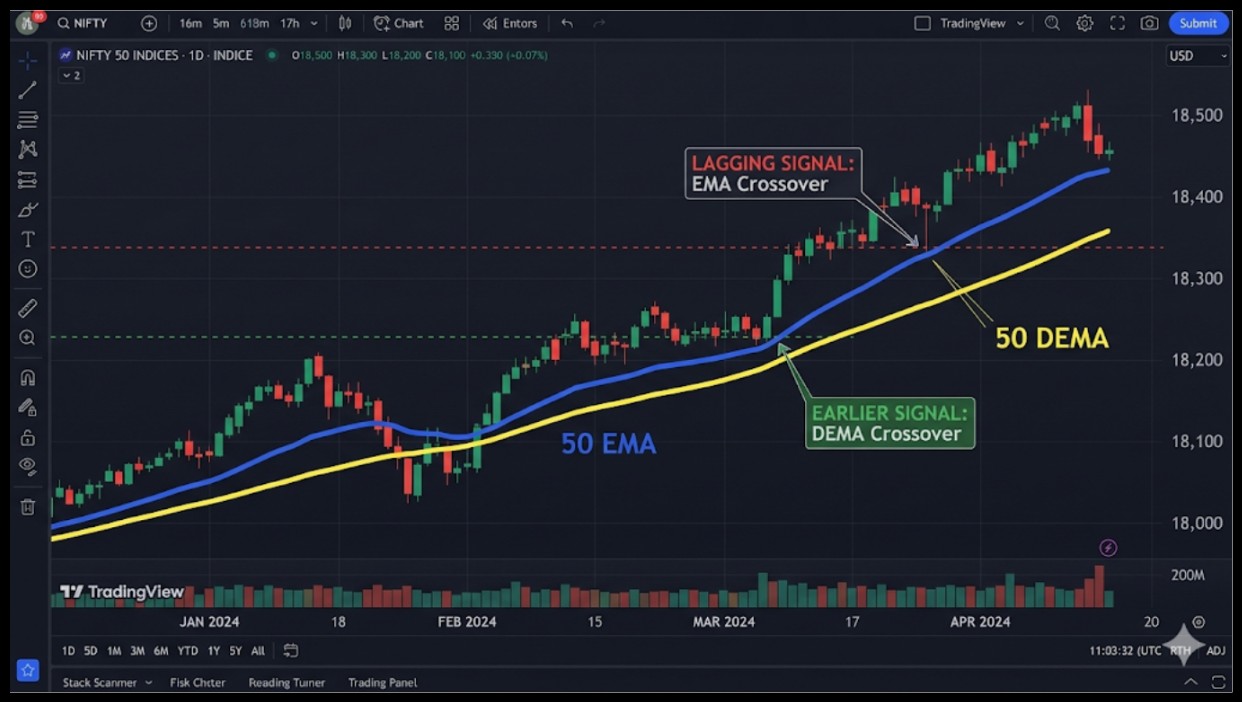
If a stock crosses above its 50 DEMA, the signal may appear slightly ahead of the 50 EMA, allowing earlier entries into upward momentum.
When to Avoid DEMA?
When both the EMA and DEMA are moving sideways and nearly horizontal, avoid relying on DEMA signals.
If the price is oscillating between two fixed levels, such as Nifty stuck between 22,000 and 22,100, DEMA can create fake crossovers.
In these irregular conditions, EMA is the safer choice because its lag helps protect against false entries.
Always check trend direction before acting on DEMA signals to reduce the risk of losses.
DEMA vs EMA: Key Differences
Knowing the difference makes it easier to decide which suits your trading strategy.
Your trading success, risk management, and entrance time may all be directly impacted by your choice.
|
Feature |
EMA | DEMA |
| Calculation | Single EMA on price |
Double-smoothed formula using two EMAs |
|
Responsiveness |
Moderate | Faster |
| Lag | More |
Less |
|
Signal Timing |
Slower | Earlier |
| Best For | Swing traders, stable trends |
Day traders, fast-moving markets |
|
False Signals |
Fewer in choppy markets |
More in choppy markets |
In practical terms, if you are a day trader watching the 15-minute chart, a DEMA might trigger entry a few minutes earlier than a standard EMA.
For swing traders holding positions for days, the difference may be less critical.
EMA vs DEMA vs TEMA: The Bigger Picture
For even quicker indications, traders occasionally overlay TEMA (Triple EMA).
Although this strategy might aid in gaining momentum sooner, it also raises the possibility of misleading signals in volatile markets.
When evaluating double EMA vs triple EMA, the main trade-off is speed versus reliability; while TEMA catches turns fastest, DEMA often provides a more balanced signal for intraday trends.
Most traders start with a classic 20 and 50 EMA crossover to define the medium-term trend. However, in fast-moving markets, waiting for these two standard lines to cross can result in a late entry.
This is where DEMA and TEMA become valuable; they allow you to run the same crossover logic but with significantly less lag, helping you enter the move closer to the actual price reversal.
|
Feature |
EMA (Exponential Moving Average) | DEMA (Double EMA) | TEMA (Triple EMA) |
| Calculation | Single EMA of price | EMA of EMA reduces lag |
EMA of EMA of EMA further reduces lag |
|
Responsiveness |
Moderate | Faster than EMA | Fastest among the three |
| Lag | Higher | Lower than EMA |
Minimal |
|
Smoothness |
Smooth, less reactive | Slightly less smooth than EMA | Less smooth, more sensitive |
| Best Use | Trend confirmation | Early trend entry |
Aggressive short-term signals |
|
Risk |
Fewer false signals | Some false signals in choppy markets |
More false signals in volatile conditions |
While speed is attractive, faster signals also increase the risk of whipsaws, especially in choppy markets.
For example, intraday traders on Bank Nifty may prefer DEMA over EMA to catch morning momentum, but a TEMA could generate too many false alarms.
How Traders Use Double EMA vs EMA?
These indicators are combined by traders in various ways. To time entries, verify patterns, and better manage risk, they rely on the distinct advantages of each instrument.
Identification of Trends:
- EMA: Verifies the direction of the trend; price above EMA indicates an uptrend
- DEMA: Signals trend start earlier; useful for catching early momentum
Entry and Exit Points:
- EMA crossover: When the short EMA crosses above the long EMA, buy; when it crosses below, sell.
- DEMA crossover: Early signals with the same reasoning, perhaps enabling better entry prior to momentum peaks
Using DEMA can give you a timing edge, but it’s important to confirm signals with trend context to avoid false entries.
Combining EMA for confirmation and DEMA for early action often leads to more balanced and confident trades.
DEMA as Dynamic Support and Resistance
The DEMA serves as a dynamic floor when prices fall back and rebound off it during a strong rally.
An early weakening of the trend may be indicated by a break below the DEMA rather than an EMA.
DEMA offers quicker, more responsive levels that assist traders in identifying possible trend pauses or reversals with better timing, even if EMA also acts as support or resistance.
Because of this, it is a useful tool for risk management, entry, and departure.
Example: Nifty 50
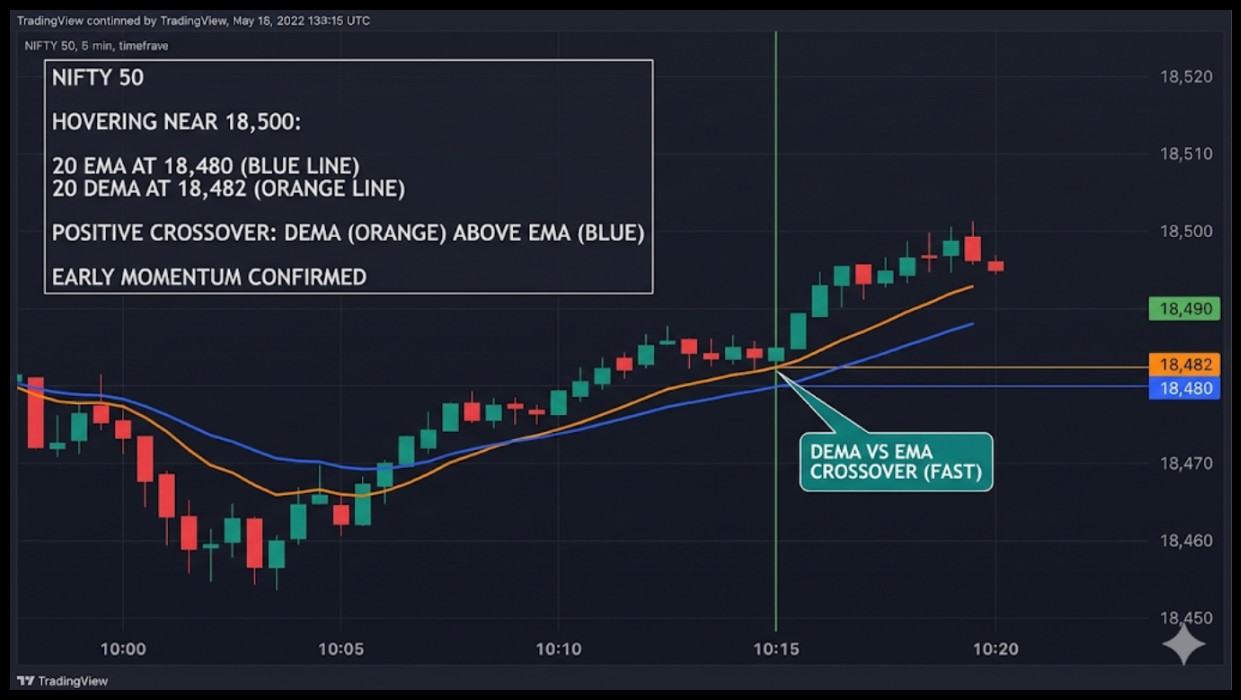
Suppose Nifty is hovering near 18,500:
- 20 EMA at 18,480
- 20 DEMA at 18,482
DEMA can provide a positive crossover prior to EMA if the price climbs to 18,490. The DEMA vs.
EMA cross allows traders to respond more quickly and seize early momentum.
Double EMA vs EMA Chart Analysis
A DEMA vs EMA chart makes the differences visually clear. It highlights how DEMA responds faster to price movements while EMA provides a smoother, more stable trend line.
Understanding how to trade EMA crossover signals on these charts is key, as the DEMA will often show a trend change several candles before the standard EMA.
- EMA is smoother and lags price slightly
- DEMA hugs price action more closely
- Crossovers occur earlier on DEMA, giving earlier potential entries
For instance, if a stock has been trending sideways and suddenly breaks above the 50 DEMA, a trader might take the signal immediately.
On the 50 EMA, the breakout may appear a few bars later.
Double EMA vs EMA Chart: A Real Example
The difference is evident when you look at the data. Plot the 20 EMA and 20 DEMA together on a Nifty 5-minute chart.
The DEMA tightly embraces the market during a robust upswing, providing earlier alerts than the EMA.
For instance, on March 5, the Nifty was at 19,200.
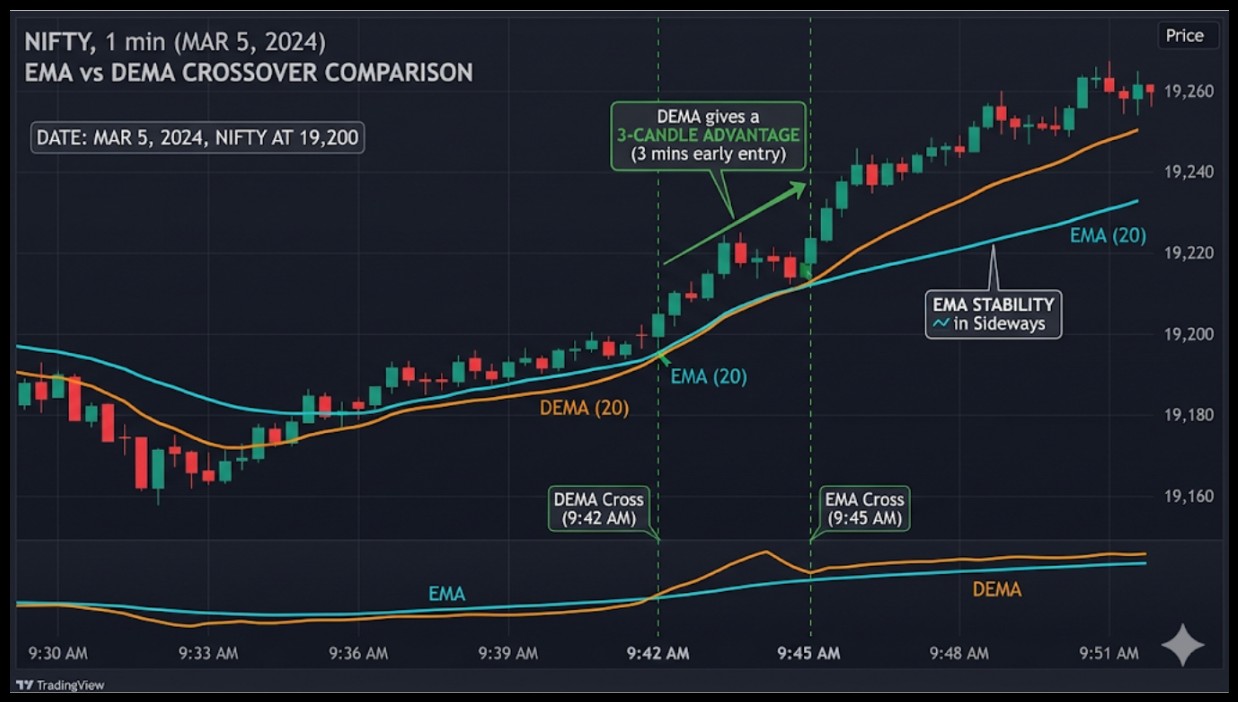
- 20 EMA crossover occurs at 9:45 AM
- 20 DEMA crossover happens at 9:42 AM
This gives traders a 3-candle advantage to enter the trend. In sideways sessions, DEMA wiggles more, while EMA remains smoother, highlighting its stability.
This visualisation helps traders understand double EMA vs EMA cross timing in real conditions.
Double EMA vs EMA Calculator: Practical Use
Calculating DEMA manually can be tedious, but modern platforms handle it easily.
Many brokers provide built-in DEMA vs EMA calculators, showing:
- Real-time crossovers
- Signal alerts
- Comparative plots of EMA and DEMA
With this tool, you may modify periods to suit your trading strategy and quickly examine how your selected moving averages interact.
Common Mistakes Traders Make
When employing EMAs and DEMAs, even the most seasoned traders make mistakes.
These blunders, which transform straightforward signals into expensive mistakes, frequently result from overconfidence or a failure to consider the context of the market.
So, it becomes important to avoid the following mistakes:
- Trading just on crossings and disregarding trend context
- Using very short periods in volatile markets, leading to false signals
- Confusing EMA and DEMA signals without examining longer-term trends
Recall that quicker signals need discipline and validation; they are not inherently superior. Context and patience are equally crucial; responding to every indication without a strategy will swiftly undo gains.
How to Decide Between EMA and DEMA?
Knowing your trading objectives and approach is essential to selecting the best tool when choosing between Double EMA and EMA.
It depends on your trading style:
- Trending market + day trading: Use DEMA
- Volatile but choppy: Use EMA
- Not sure of market condition: Use EMA for direction, DEMA for entry timing
- Swing trading positions: Stick with EMA to avoid noise
In reality, a lot of traders use both: DEMA for entry timing and EMA for trend confirmation.
This strategy lessens the likelihood of being caught in false breakouts by striking a balance between speed and dependability.
Conclusion
The Double EMA vs EMA debate does not end with one being better. It ends with you knowing which one fits your strategy.
DEMA gives you speed and early signals, while EMA gives you stability and cleaner reads. The real edge comes from combining both and understanding when each belongs on your chart.
Test the crosspoints, run the numbers, and watch how each behaves when markets get volatile. Because traders who understand their tools do not just follow signals, they know why those signals appear.
Master that, and your entries, exits, and risk management will never be the same.
Unlock the full potential of Double EMA vs EMA. Join our technical analysis classes to learn how these indicators work in real market conditions with practical guidance.
FAQs
Q1: Is DEMA always better than EMA?
Ans: Not necessarily. DEMA is faster but can produce false signals in choppy markets. EMA is more stable and may suit longer-term trades.
Q2: Can I use DEMA and EMA together?
Ans: Indeed. A lot of traders utilise DEMA to time entry and EMA to confirm trends. This combination strikes a compromise between dependability and quickness.
Q3: What is the difference between DEMA and TEMA?
Ans: DEMA uses two EMAs in its calculation, while TEMA uses three. TEMA is faster but more sensitive to market noise, ideal for aggressive traders.
Before investing capital, invest your time in learning Stock Market.
Fill in the basic details below and a callback will be arranged for more information:


