

When the rally continues to go higher and higher, but you know something is not right?
Price is increasing, but the momentum seems weak as each new high takes more effort and delivers less movement than the last. Candles overlap, and breakouts start to fail.
That uneasy stretch near the top often hides one specific structure: the Elliott wave ending diagonal.
This pattern is not random noise. It occurs at the end of a bigger move, typically in Wave 5 of an impulse or Wave C of a correction.
And when it appears, it whispers one thing: the trend is wearing out.
Let’s break it down clearly and practically.
What Is Elliott Wave Ending Diagonal?
Many people often ask this one question: What is the Elliott wave ending diagonal?
It is a pattern of five waves that appear at the end of a trend. Unlike a normal impulse, it has overlapping waves and is embedded between two convergent trendlines.
It is similar to an uptrend of a rising wedge or a falling wedge downtrend.
Here is what makes it different from a standard impulse:
- All five waves can be divided into zigzags, not impulses.
- Wave 4 overlaps Wave 1.
- Waves 1 and 3, as well as waves 2 and 4, converge on trendlines.
That overlap is important. Normal impulse does not allow Wave 4 to penetrate Wave 1 territory.
However, in an Elliott ending diagonal wave, an overlap is permitted. That is not a violation. That is the feature.
Traders often keep an Elliott wave cheat sheet handy to remember that while this looks like a diagonal, its internal structure is entirely different from an Elliott wave leading diagonal, which typically appears at the start of a trend rather than the end.
The Internal Elliott Wave Ending Diagonal Structure (3-3-3-3-3)
An internal wave structure of an ending diagonal has the pattern of 3-3-3-3-3, which is quite different from a normal impulse wave.
In a normal impulse, such a structure is generally 5-3-5-3-5 so that the motive waves are powerful in five sub-waves.
Conversely, there is an ending diagonal, which consists of all five waves and is further subdivided into three waves, indicating that the trend is weakening.
As each sub-wave is corrective as opposed to impulsive, it means that the pattern can frequently be overlaying and disjointed on the chart itself, which is an obvious visual indicator that the bigger trend is getting drained.
Contracting Vs Expanding Ending Diagonal
Ending diagonals can appear in two visual forms. Recognizing the difference helps traders read momentum correctly and avoid entering late.
| Feature | Contracting Ending Diagonal | Expanding Ending Diagonal |
| Trendline Shape | Trendlines converge toward each other | Trendlines diverge outward |
| Pattern Appearance | Forms a wedge that narrows over time | Structure widens as waves progress |
| Wave Size | Each wave becomes slightly smaller | Waves generally become larger and more volatile |
| Wave 1 Characteristic | Not necessarily the longest wave | Wave 1 is usually the shortest |
| Wave 5 Behavior | Often reaches or slightly touches the upper boundary | May fail to reach the upper boundary, creating an uneven look |
| Market Signal | Momentum gradually weakens before reversal | Volatility increases before reversal |
| Occurrence | More common in markets | Relatively rare pattern |
Elliott Wave Ending Diagonal Rules
Before trading it, you need clarity. The Elliott wave ending diagonal rules are precise.
While there are many corrective wave types in the market, such as Flats, Zigzags, and Triangles, the Ending Diagonal is unique because it acts as a motive wave with a corrective internal soul.
Here is what must happen:
- It must consist of five waves, which are called 1 2 3 4 5.
- The five waves further break down into a three-wave structure (correctional, generally a zigzag structure).
- Wave 2 of an ending diagonal never continues past the initial point of Wave 1.
- Wave 4 overlaps Wave 1 & usually breaks beyond the ending point of Wave 2.
- Wave 3 cannot be the shortest & always breaks the ending point of Wave 1.
- Wave 5 typically attempts to break the ending point of Wave 3, but truncation is a recognized and valid exception where Wave 5 fails to reach that level.
- Wave 5 can be truncated (it can fail to reach the upper trendline).
- Trendlines must converge or at least contract.
If those elements are missing, it is not an ending diagonal. It may be a wedge pattern, but not an Elliott structure.
Here is a quick comparison:
| Feature | Normal Impulse | Ending Diagonal |
| Wave 4 Overlap | Not allowed | Allowed |
| Subdivision | 5 wave impulses | 3 wave zigzags |
| Location | Any impulse | Wave 5 or Wave C |
| Shape | Expanding trend | Converging wedge |
See the contrast?
The overlap rule flips. That is where many traders get confused.
Throw-Over: The Final Trap Before the Reversal
A typical characteristic that occurs at the end of an Elliott Wave ending diagonal is a throw-over. Here, the fifth wave is momentarily overriding the trendline marked by the 1 and 3 ends.
It appears like a bullish breakout, yet the truth is that it is usually the conclusive exhaustion move before experiencing a sudden turnaround.
Volume typically fades during the diagonal and then spikes slightly during the throw-over.
Traders who mistake this move for continuation often enter long at the worst possible moment, just before the market turns.
Elliott Wave Ending Diagonal Example
Let’s make this practical with a clean Elliott wave ending diagonal example:
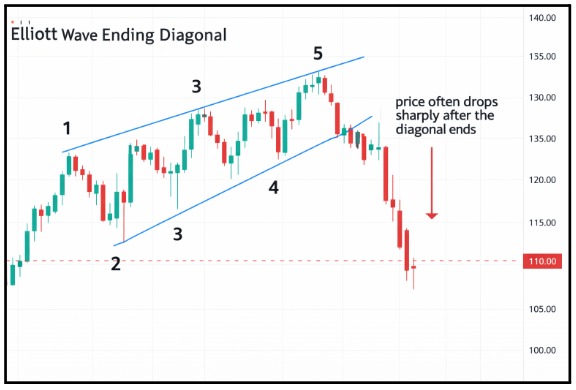
Assume a stock moves like this:
- Wave 1: 100 to 120
- Wave 2: 120 to 110
- Wave 3: 110 to 130
- Wave 4: 130 to 115
- Wave 5: 115 to 135
Notice something?
- Wave 4 overlaps Wave 1 territory
- Highs are rising, but each wave looks corrective
- The range narrows
If you draw trendlines connecting Wave 1 and 3 highs, and Wave 2 and 4 lows, they converge. That creates a wedge.
Once Wave 5 is finished (around 135), the price has tended to collapse, sometimes even falling back to 110 or below.
This reversal affirms the trend.
How To Trade The Elliott Wave Ending Diagonal?
An ending diagonal normally shows at the last phase of a trend, normally Wave 5 of an impulse or Wave C of a correction. The trend indicates that the momentum is weakening, and an inverted reversal may happen.
To the traders, nothing is difficult; they merely have to spot the pattern and be ready to pull out the move that, in most cases, reverses the whole diagonal formation.
Two typical methods of entry for traders are listed below:
1. Aggressive Entry Near Wave 5 Completion
This method aims to catch the reversal as early as possible. Traders watch for Wave 5 approaching the upper boundary of the diagonal pattern.
Once the price begins to stall near that area, a reversal trade can be opened.
Example:
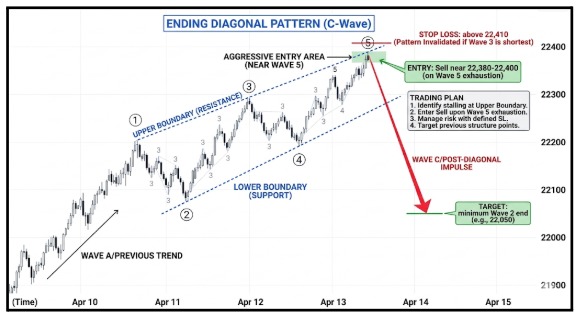
Between 22,000 and 22,400, Nifty has formed an ending diagonal. Wave 5 gets close to the upper boundary around 22,400, and the price begins to lose its momentum.
- Entry: Sell close at 22,380 to 22,400 when the 5th wave turns out to be exhaustive.
- Stop Loss: Above the point where Wave 3 would become the shortest wave.
- Target: Minimum target is the end of Wave 2, for example, 22,050.
This entry offers a better reward potential but carries more risk because the pattern may extend slightly before reversing.
2. Safer Entry On The 2-4 Trendline Break
A more conservative method is to wait for confirmation that the pattern has actually broken down.
A trend line may be drawn between waves 2 and 4 in an ending diagonal. When the price cracks down to this price line, it is usually the beginning of the reverse.
Example:
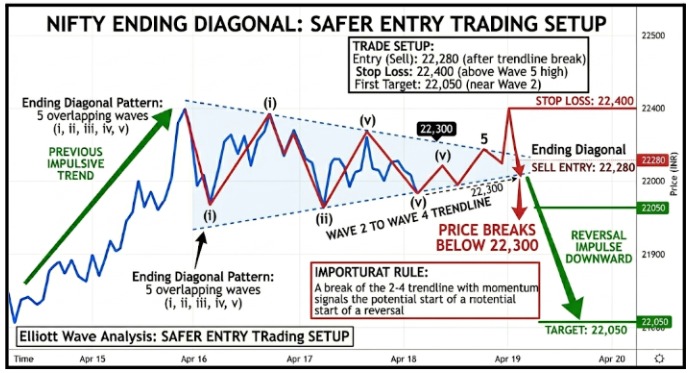
Using the same Nifty setup:
- The Wave 2 to Wave 4 trendline sits near 22,300.
- Price breaks below 22,300 with strong momentum.
Trade setup would look like this:
- Entry: Sell after the trendline break at 22,280.
- Stop Loss: Above the recent Wave 5 high near 22,400.
- Target: First target remains the Wave 2 level near 22,050.
This approach sacrifices a bit of profit potential but greatly improves trade confirmation.
Typical Price Target After The Pattern
Regardless of the entry method, a key rule in trading an ending diagonal is that the price often retraces the entire diagonal quickly.
The end of Wave 2 is usually the first minimum target, and in severe reversals, it can go further.
For traders, the concept is simply to wait and watch until a diagonal is complete and ensure the reversal is made after that, and then target the retracement area where the pattern had initially started picking up.
Common Mistakes To Avoid For Traders
Ending diagonals look similar to simple wedges. But they are not the same.
Avoid these errors:
- Labeling any wedge as an ending diagonal.
- Ignoring the zigzag subdivisions.
- Forgetting that it must appear in Wave 5 or Wave C.
- Treating it as a continuation instead of a reversal risk.
The pattern suggests termination, not acceleration.
Conclusion
Markets do not reverse without warning. They leave clues, and the Elliott wave ending diagonal is one of the clearest ones.
When you see overlapping waves, fading momentum, and a converging wedge near the top of a trend, the market is not building energy for another push higher. It is running out of fuel.
The ending diagonal is that final, labored effort before exhaustion sets in.
What makes this pattern genuinely useful is its precision. The rules are strict, the structure is specific, and the reversal that follows is often sharp enough to make the wait worthwhile.
Most traders chase breakouts. The ones who study ending diagonals learn to fade them instead.
That edge does not come from luck. It comes from reading what the market is actually telling you, one wave at a time.
Spot an Elliott Wave Ending Diagonal before the crowd does.
Want to master these setups?
Join our stock market course and accelerate your learning curve.
FAQs
Q1: What is an Elliott wave ending diagonal in simple terms?
Ans: It is a five-wave wedge formation that appears when a trend ends, and it denotes exhaustion followed by reversal.
Q2: Are Elliott wave ending diagonal rules strict?
Ans: Yes. Waves must subdivide into zigzags, overlap is required, and it must appear in Wave 5 or Wave C.
Q3: What happens after an ending diagonal completes?
Ans: Price typically reverses sharply and retraces the entire diagonal move quickly.
Before investing capital, invest your time in learning Stock Market.
Fill in the basic details below and a callback will be arranged for more information:


