
What if your wave count is correct but your trade still fails? That is more common than most traders admit.
The missing piece is almost always time.
Elliott Wave Time Cycles are a part of wave analysis that most traders either skip or never learn properly.
If you want to master how to do Elliott Wave analysis like a professional, you must look beyond just the vertical price movement and start watching the horizontal rhythm of the market.
They estimate the duration of each wave using Fibonacci relationships, helping you judge whether a correction is still developing or nearly complete.
Elliott himself noticed that waves respect Fibonacci numbers not just in price but also in time.
Understanding this rhythm does not just improve your entries, but it completely changes how you read a chart.
In this blog, let us understand the Elliot wave times cycles.
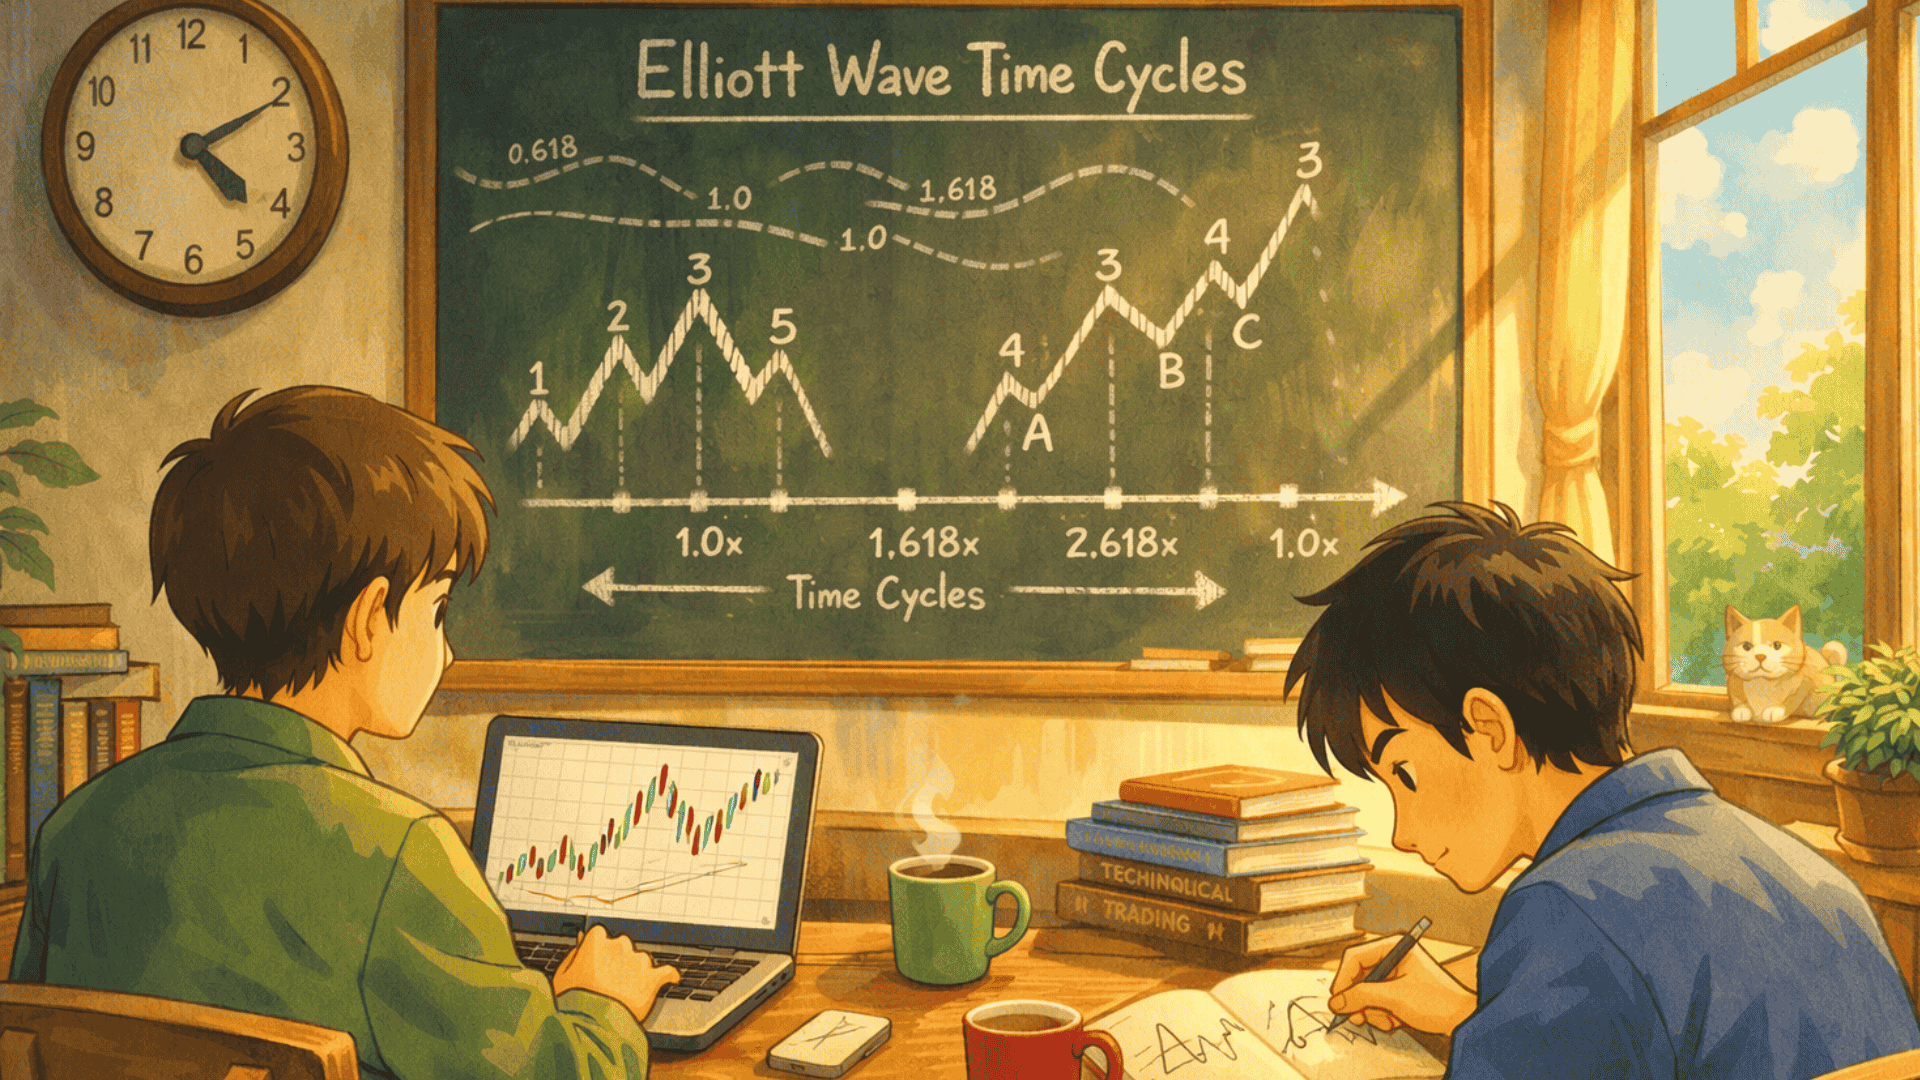
What are Elliott Wave Time Cycles?
Before focusing on time, remember the foundation. Elliott Wave Theory says markets move in five impulse waves followed by three corrective waves. Price forms the structure. Time gives it rhythm.
Many new traders ask, How long does it take to learn Elliott wave? The answer depends on how deeply you study both price and time together.
Elliott Wave time cycles estimate the length of each wave and follow the Fibonacci associations to more adequately predict the potential length of subsequent waves.
Elliott noticed that the relation of waves to Fibonacci numbers occurs in both price and time. It means that waves often have a duration of 5, 8, 13, 21, 34, or 55 time units.
These units may be days, weeks, or even months.
They are useful to provide an answer to one essential question: Is this correction mature, or is it still developing?
Why Elliott Wave Time Cycles Matter?
Most traders obsess over targets. They mark 161.8 percent extensions and 61.8 percent retracements. That’s fine.
But what if wave 2 corrects sharply in price yet finishes too quickly compared to wave 1?
That’s often a red flag.
When applying Elliott wave theory with Fibonacci, the synergy between price levels and time units becomes the ultimate filter for false breakouts.
Here’s the core idea behind Elliott Wave Time Cycles:
- Impulse waves often show Fibonacci time relationships.
- Corrections frequently consume equal or related time compared to prior waves.
- Larger degree waves take proportionally longer than smaller degree waves.
Time keeps the wave count balanced. Without it, the structure feels forced.
Bank Nifty Elliott Wave Time Cycle
Now let’s make this practical.
Bank Nifty is known for sharp moves and fast corrections. When applying the Bank Nifty Elliott Wave Time Cycle, traders often struggle to decide which time frame is best for Elliott wave analysis on such a volatile index.
Most prefer the daily or 4-hour charts to find reliable cycles.
Suppose:
- Wave 1 rallies for 13 trading days.
- Wave 2 corrects for 8 trading days.
- Wave 3 extends strongly for 21 trading days.
When wave 4 begins, you would watch the 8 to 13-day window closely. If wave 4 stretches beyond 21 days, the count may be wrong or evolving into a complex correction.
Bank Nifty respects time symmetry surprisingly well during trending phases. However, during news-driven volatility, time relationships stretch. That’s where experience matters.
You don’t force the cycle. You observe it.
Nifty 50 Elliott Wave Time Cycle
Nifty 50 behaves differently. It tends to move with a broader structure and slightly smoother corrections compared to Bank Nifty.
In a typical Nifty 50 Elliott Wave Time Cycle setup on the daily chart:
- Wave 1 lasts 21 trading days.
- Wave 2 corrects for 13 trading days.
- Wave 3 extends for 34 trading days.
Now, when wave 4 starts, traders often monitor the 13 to 21-day window. If price stabilizes within that duration and holds key retracement levels, the probability of wave 5 beginning increases.
Here’s the key difference. Nifty 50 often forms time-consuming sideways corrections, such as flats or triangles. Those structures can consume more time than expected while staying shallow in price.
That mismatch between time and price confuses many traders. But it’s normal.
Elliott Wave Time Cycle Rules
Time symmetry helps traders judge whether a correction is nearing completion. Waves in Elliott Wave analysis are usually harmonized in price and time.
In cases where the timing of the waves follows some recognisable relationship, it becomes easier to determine whether the correction has space to develop or is nearly over.
Key practical time relationships traders watch:
- Wave A and Wave C time equality: Wave C tends to take as much time as Wave A. Assuming the length of Wave A was four sessions, traders assume that Wave C will happen within an approximate time.
- Wave 2 and Wave 4 time alternation: When Wave 2 is sharp and short-lived, Wave 4 tends to have a slow and lateral unfolding.
- Wave 3 time expansion: Wave 3 often extends 1.618 times the price length of Wave 1, and in terms of time, it typically takes longer to complete than Wave 1, often spanning 1.618 times its duration.
How Fibonacci Connects To Elliott Wave Time Cycles?
Fibonacci numbers appear everywhere in wave analysis. In such cycles, traders measure the duration of a completed wave and project Fibonacci multiples forward.
This technical layer, often called Elliott wave time analysis, allows you to look past the vertical price move and see the horizontal maturity of the trend.
For example:
| Wave Completed | Time Taken | Possible Next Wave Duration |
| Wave 1 | 8 days | Wave 2 may last 5 or 8 trading days |
| Wave 2 | 5 days | Wave 3 may last 8 or 13 trading days |
| Wave 3 | 21 days | Wave 4 may last 13 or 21 trading days |
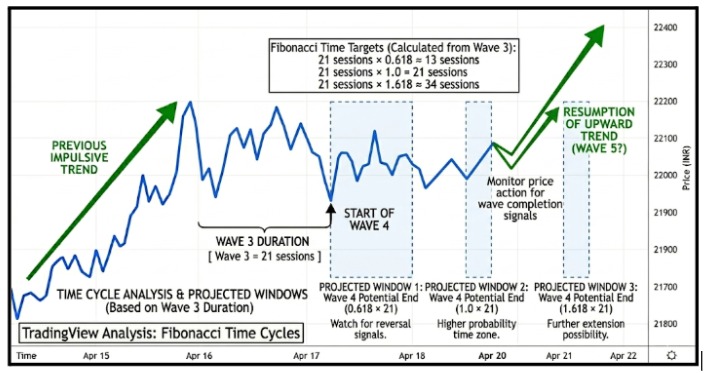
To use Fibonacci Time Projections, find a completed wave, measure its duration in trading sessions, and apply Fibonacci multipliers of 0.618x, 1.0x, and 1.618x to project time windows forward.
Tools like the Fibonacci Time Zone on TradingView make this process quick and visual.
Time-Price Confluence: When Time And Price Agree
Elliott Wave time cycles become truly powerful when time projections and price retracement levels align at the same point.
This alignment is called time-price confluence. Professional traders often wait for this overlap before entering trades because it confirms both where the market may turn and when the move could occur.
When Fibonacci time cycles match Fibonacci price levels, the probability of a reversal or continuation increases significantly.
Key signals traders watch for:
- Wave 4 retracing near the 38.2% Fibonacci price level
- Fibonacci time projection showing Wave 4 completion at the same zone
- Price is slowing or consolidating near that level
- Entry planned once both time and price confirm the wave count, with a stop loss placed below the recent swing low to manage downside risk
Common Mistakes While Using Elliott Wave Time Cycles
Let’s address what goes wrong. Because it often does.
- Treating Time As A Precise Clock: Time cycles are zones, not exact dates. Markets don’t ring a bell when a Fibonacci count completes.
- Ignoring Wave Degree: A 5-day correction on a 15-minute chart is not comparable to a 5-day correction on a daily chart. Always match the degree to the timeframe.
- Forcing Fibonacci Counts: Sometimes, waves simply do not respect Fibonacci time perfectly. When that happens, structure takes priority over time.
Remember this rule. Price confirms. Time supports.
- Measuring From The Wrong Starting Point: Many traders calculate time cycles from the wrong anchor point. For example, they may measure Wave 2 from when the price started falling instead of the exact Wave 1 high, or count calendar days instead of actual trading sessions.
These small measurement errors distort time projections and lead to incorrect expectations about when the next wave should complete.
How To Measure and Apply Time Cycles?
Once you identify a completed wave and measure how long it lasted, the next step is projecting Fibonacci time cycles forward.
This helps traders estimate when the next wave may finish. The goal is not to predict an exact date but to identify time windows where reversals are more likely.
How Traders Apply This:
- Measure the duration of the completed wave. Example: Wave 3 = 21 sessions
- Multiply by Fibonacci ratios
- 0.618 × 21 = 13 sessions
- 1.0 × 21 = 21 sessions
- 1.618 × 21 = 34 sessions
- Project these time windows forward from the start of Wave 4
- Monitor price action as it approaches these time zones for potential wave completion signals.
Remember, these time windows are not exact reversal points but high-probability zones.
Always monitor price action, wave structure, and Fibonacci levels together within these zones for the strongest confirmation before making any trading decision.
Conclusion
Elliott Wave Time Cycles remind us that markets move with rhythm, not chaos. Price shows direction, but time reveals maturity.
When you measure how long waves unfold, your entries become calmer and your exits more confident.
Combine time with structure and Fibonacci levels, and you gain context that most traders miss. In trading, timing is not everything, but without timing, everything feels uncertain.
Want to master Elliott Wave Time Cycles with real chart examples? Download the Stock Pathshala app or join our stock market classes for detailed, practical sessions.
FAQs
Q1: Does Bank Nifty Respect Elliott Wave Time Cycles?
Ans: Yes, especially during trending phases. However, high volatility events can stretch time relationships.
Q2: Is the Nifty 50 Elliott Wave Time Cycle Reliable?
Ans: The Nifty 50 Elliott Wave Time Cycle is reasonably reliable during trending market phases when combined with price structure and Fibonacci retracement levels.
However, during sideways or news-driven markets, time relationships can stretch or compress, so time projections should always be used alongside price confirmation rather than in isolation.
Q3: Can Elliott Wave Time Cycles Help Estimate When A Correction Might End?
Ans: Yes, traders often compare the duration of previous waves to estimate when a corrective phase may likely complete.
Before investing capital, invest your time in learning Stock Market.
Fill in the basic details below and a callback will be arranged for more information:


