

The first time a trader opens a chart and hears about Elliott Wave, the reaction is often the same. Curiosity mixed with confusion.
Five waves up, three waves down, impulse, correction, extensions, and diagonals. At first glance, it looks like a puzzle drawn on price charts.
So the obvious question appears quickly: how long does it take to learn Elliott Wave?
The honest answer?
It is according to your level of understanding. The fundamentals can be mastered in just a few weeks by some traders. But consistent, confident usage in real trading usually takes three months to a year.
That sounds long, yet markets are complex systems. The Elliott Wave is not just a theory. It is pattern recognition, psychology, probability, and risk management rolled together.
Let’s break it down in a practical way.
What Elliott Wave Really Involves?
Before discussing how long does it take to learn Elliott Wave, let’s discuss a bit about what the theory actually is. It will help to understand what you are actually learning.
The Elliott Wave Principle explains how financial markets move in repeating patterns driven by investor psychology. These patterns appear as waves.
Basic Market Structure:
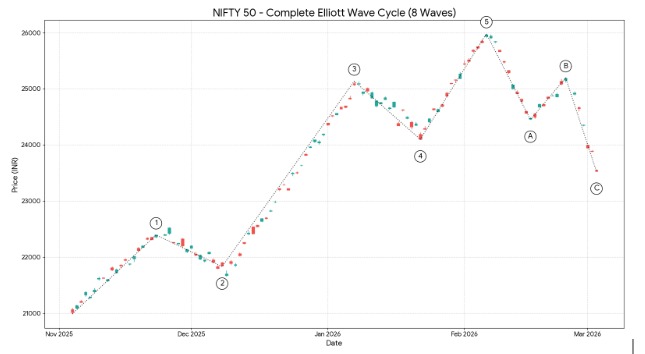
In the image given above, you can see the representation of Elliott waves marked as 1, 2, 3, 4, 5, A, B, and C.
A complete cycle has 8 waves.
Let’s try to understand them through the table given below:
| Wave Type | Direction | Description |
| Wave 1 | Trend | First move upward |
| Wave 2 | Correction | Pullback |
| Wave 3 | Trend | Strongest move |
| Wave 4 | Correction | Consolidation |
| Wave 5 | Trend | Final push |
| Wave A | Correction | Start of decline |
| Wave B | Temporary bounce | Within the corrective phase |
| Wave C | Final correction | Completes correction |
Most traders struggle not because the rules are hard. They struggle because the detection of waves in real time is a challenge.
This takes a lot of practice and time to master the skills needed. So let’s understand in the next section how long it takes to learn the Elliott wave.
How Long Does It Take To Learn Elliott Wave?
Many new traders want a fast answer. Unfortunately, markets rarely reward shortcuts. A realistic learning path often looks like this.
Stage 1: Understanding Elliott Wave Rules
The first step usually starts by knowing the basic rules that are necessary to understand the Elliott wave theory.
During this phase, you are essentially learning to identify the standard Elliott Wave Chart Pattern and how it repeats across different timeframes.
Time required: 2 to 3 weeks
At this stage, you learn:
- Impulse vs corrective waves.
- Wave structure rules.
- Common patterns like the zigzag correction pattern and the flat corrective pattern.
You will also spend time identifying the Diagonal Triangle Pattern, which often appears at the end of a trend to signal exhaustion.
For example, one rule states: Wave 3 cannot be the shortest impulse wave.
Note: You can look at a finished chart and correctly label the 5 impulses and 3 corrective waves without referring to notes, and you can state all three non-negotiable rules from memory.
Stage 2: Reading Real Charts
Since this theory will apply to real trading setups, you need to have a proper understanding of reading real charts.
Time required: 1 to 3 months
This is where theory meets reality.
You start labeling waves on charts, such as:
- Bitcoin
- Nifty 50
- EURUSD
- Apple stock
A quick example:
| Wave | Price Move |
| Wave 1 | Nifty rises from 18,000 to 18,500 |
| Wave 2 | Pullback to 18,250 |
| Wave 3 | Rally to 19,300 |
Wave 3 often becomes the strongest momentum move. Many traders enter here.
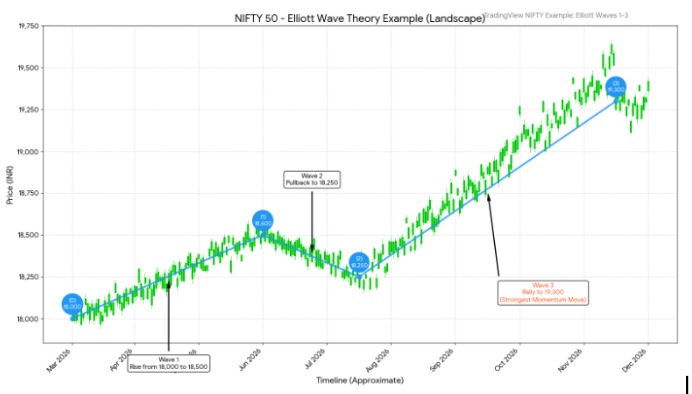
But beginners often mislabel corrections. That is normal.
Note: You can open a daily chart of any liquid stock or index, identify the most recently completed impulse or corrective structure, and label it correctly on TradingView without making rule violations.
Stage 3: Using Elliott Wave In Trading
Now, after you have mastered real charts, you can begin to learn and use the Elliott wave in trading.
Time required: 3 to 12 months
This stage changes everything. Now you move beyond just labeling past moves and begin to develop specific Elliott Wave strategies for trading that help you find high-probability entries.
Now you combine wave analysis with:
- Fibonacci levels
- Elliott wave time cycles (to predict when a wave might end)
- Support and resistance
- Risk management
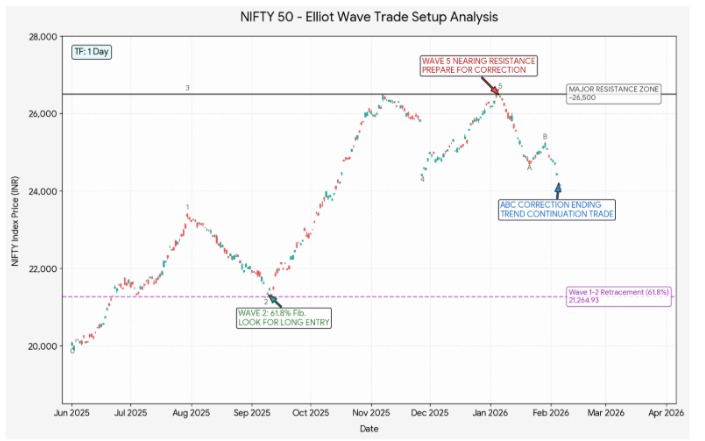
Example trade setup:
| Scenario | Trade Idea |
| Wave 2 retracement near 61.8% Fibonacci | Look for a long entry |
| Wave 5 nearing resistance | Prepare for correction |
| ABC correction ending | Trend continuation trade |
Real trading decisions begin here.
And mistakes become your best teacher.
Note: You can enter at least 5 live paper trades using wave-based setups, place stops at the correct wave invalidation level, and explain your wave count reasoning before entering.
Stage 4: Advanced Refinement (12 Months And Beyond)
After about a year of consistent chart practice, traders usually move beyond basic wave counting. At this stage, Elliott Wave becomes less about memorizing rules and more about recognizing subtle market behavior.
Traders begin identifying advanced wave formations, combining multiple timeframes, and building a personal system for labeling waves with greater confidence.
In this phase, learning never really stops. The focus shifts toward refining judgment, reducing counting errors, and improving trade timing.
Key Skills Developed In Stage 4:
- Recognizing wave extensions, especially extended Wave 3 or Wave 5.
- Identifying truncations, where the final wave fails to break the previous high or low.
- Analyzing complex corrections such as double zigzags and combinations.
- Using multi-timeframe confluence to align daily, hourly, and intraday wave counts.
- Developing a personal wave labeling system that stays consistent across charts.
| Focus Area | What Traders Learn |
| Advanced Patterns | Extensions, truncations, and complex corrections |
| Multi-Timeframe Analysis | Aligning wave counts across different chart timeframes |
| Trade Precision | Timing entries around high-probability wave completions |
| Personal Method | Creating a consistent approach to wave labeling |
At this stage, Elliott Wave analysis becomes less mechanical and more intuitive. Traders start seeing market structure more clearly, which helps them filter weak setups and focus only on high-probability wave completions.
Common Mistakes While Learning Elliott Wave
Many traders feel stuck while learning Elliott Wave because early mistakes distort their analysis.
Emotions often push traders to force wave counts that match expectations instead of what the chart actually shows.
One simple fix is to zoom out to a higher timeframe; it helps reveal the broader trend and reduces bias.
Avoid these common learning mistakes:
- Jumping to live trading before finishing proper chart practice.
- Practicing only on completed charts instead of real-time labeling.
- Treating guidelines as rigid rules.
- Ignoring corrective patterns and studying only the 5-wave impulse.
If you avoid making these common mistakes, you can face difficulty in learning the Elliott wave.
Factors Affecting the Time Taken to Learn Elliott Wave
Not every trader learns at the same speed. Several factors influence progress.
Your consistency, chart practice, and ability to recognize patterns in different market conditions also play a big role in how quickly you understand wave structures.
1. Trading Experience
A trader already familiar with chart patterns learns faster than someone new to markets.
They already understand market behavior such as breakouts, pullbacks, and trend momentum, which makes identifying wave structures much easier.
2. Time Spent Practicing
Daily chart analysis accelerates learning dramatically.
The more charts you review, the faster your brain starts recognizing wave patterns and market behavior in real trading conditions.
| Practice Time | Learning Speed |
| 10 minutes daily | Slow progress |
| 30 minutes daily | Moderate progress |
| 1 hour daily | Fast improvement |
3. Market Observation
Watching live markets helps. Markets behave differently during:
- Strong trends
- Sideways markets
- News-driven volatility
Wave structures adapt to these environments.
Tools That Help Traders Learn Elliott Wave Faster
Modern charting platforms make learning easier. They allow traders to visualize wave structures clearly and test ideas directly on price charts.
With built-in drawing tools and historical chart data, traders can practice wave counting and review past market behavior without risking real money.
Some widely used tools include:
| Tool | Purpose |
| StockPathshala | Educational material |
| TradingView | Wave labeling tools |
| Fibonacci retracement tool | Wave confirmation |
| Replay mode in charts | Practice past market moves |
Replay tools are especially useful. You can pause charts and test your wave analysis step by step. Many professional traders learned this way.
Conclusion
So, how long does it take to learn Elliott Wave?
Basic understanding may take a few weeks. Real confidence usually develops after several months of chart practice.
But here is the interesting part.
Elliott Wave never feels fully mastered as markets evolve, patterns stretch, compress, or behave unexpectedly.
And that challenge keeps traders engaged.
Think of it like learning a musical instrument. The notes are simple, but the mastery comes from repetition.
Charts become clearer with time. Waves start telling a story. And once you see that story, trading decisions become far more structured.
Master Elliott Wave the right way with expert guidance. Join our stock market classes and start reading market waves like a professional trader.
FAQs
Q1: Is The Elliott Wave Principle Easy To Learn?
Ans: The fundamental rules are not complex, but they need to work on real charts to apply them. Most traders understand the theory quickly but need several months to read waves consistently.
Q2: Can I Learn Trading In 3 Months?
Ans: Yes, you can learn trading basics within three months. However, developing a consistent strategy, risk control, and discipline usually takes longer.
Q3: What Is The Best Timeframe For Elliott Wave?
Ans: Elliott Wave works on all timeframes. Many traders prefer 4-hour, daily, or weekly charts because wave structures appear clearer and less noisy.
Before investing capital, invest your time in learning Stock Market.
Fill in the basic details below and a callback will be arranged for more information:


