



Elliott wave vs dow theory is a question almost every chart reader asks sooner or later. Both try to explain how markets trend, but they go about it in very different ways.
In this blog, we compare them side by side, so you can see where each one fits.
The Core Difference Between Elliott Wave And Dow Theory
Think of Dow theory as a trend checker and Elliott wave as a trend storyteller. One tells you the direction, the other tries to tell you where in the move you are.
Dow theory is about direction and confirmation. Elliott wave is about structure and crowd psychology.
That one idea explains most differences below.
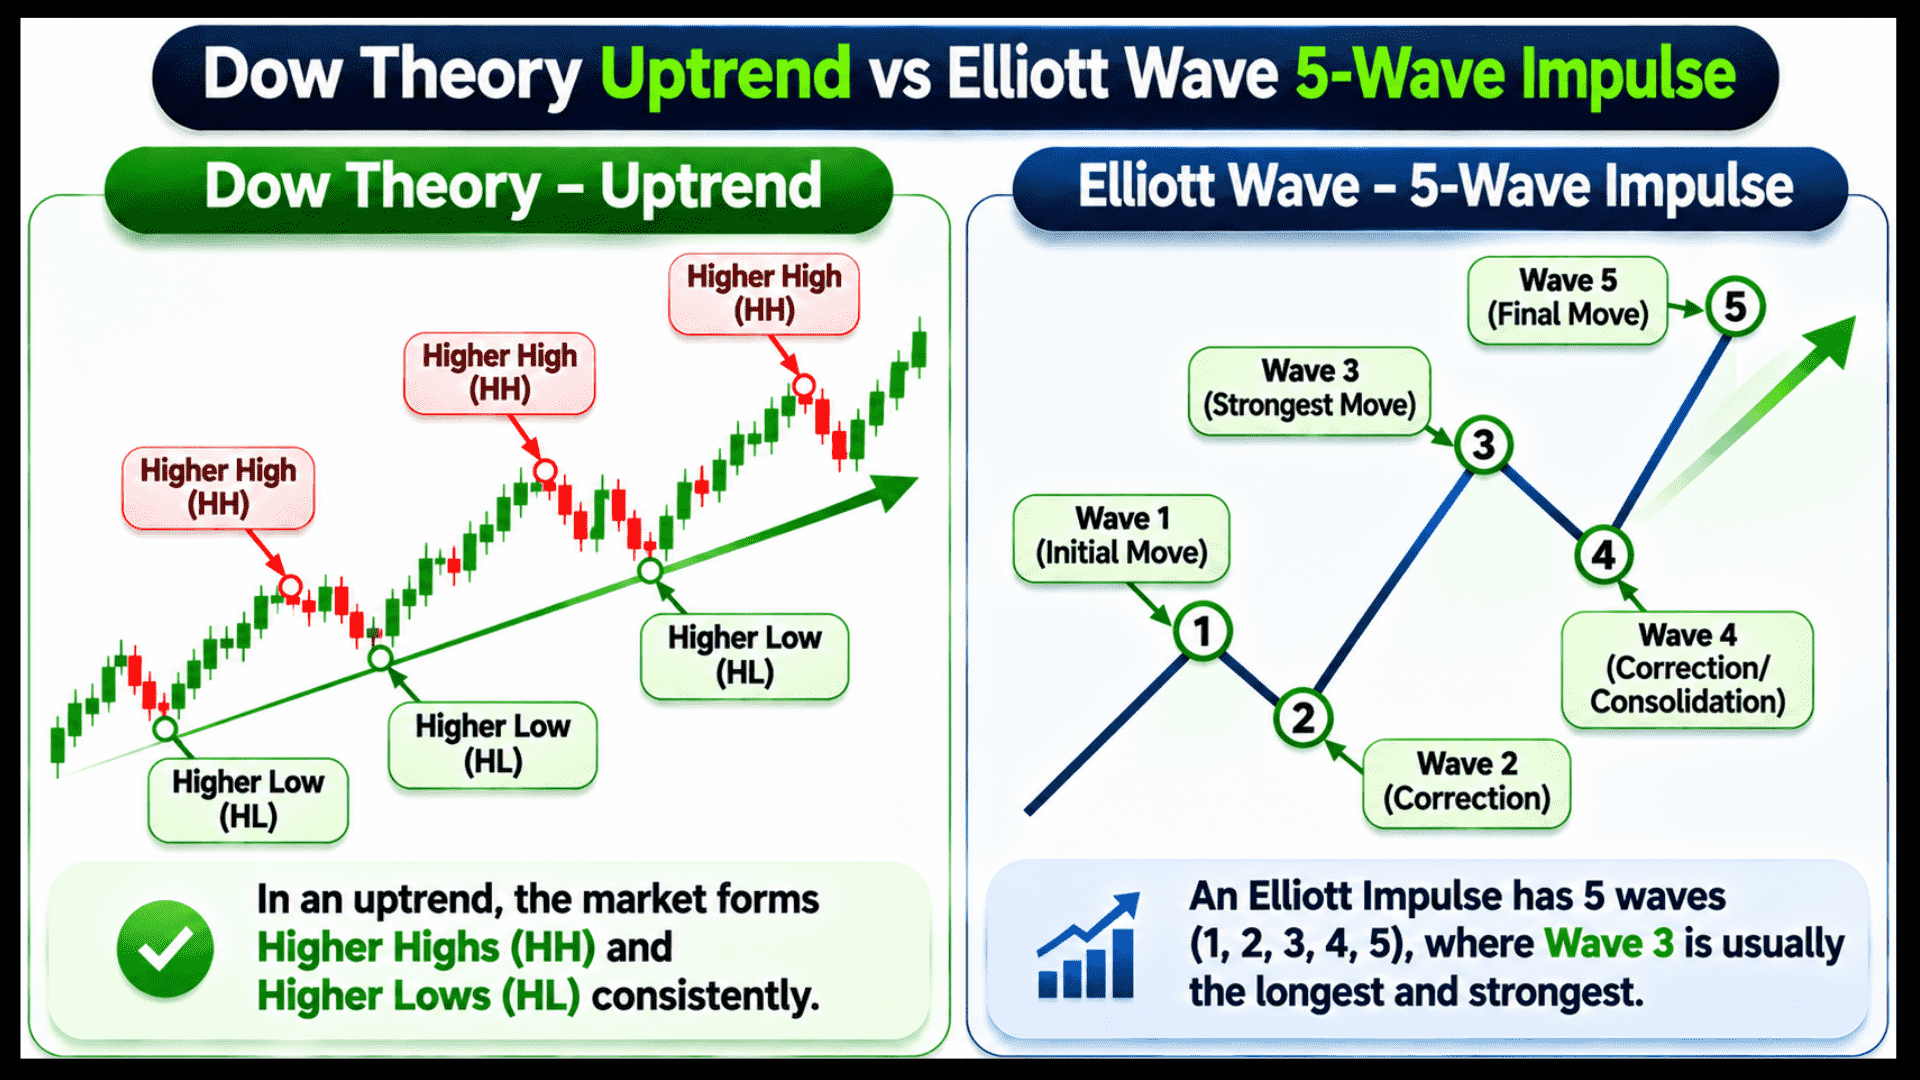
Where Did Dow Theory and Elliott Wave Come From?
Both ideas are old, and both came from careful chart observation. Knowing the origin makes the differences easier to remember.
Dow theory came first, from newspaper editorials on how the market behaves. Elliott wave came decades later, from a study of repeating price patterns and crowd mood.
Below, we look at each idea in simple words. This will help you see why one focuses on direction and the other on structure.
Dow Theory Explained in Simple Words
Charles Dow, a co-founder of a well-known financial newspaper, wrote about market behaviour in the late 1800s. Later writers organised his editorials into what we now call Dow theory.
The big idea is simple. The market moves in trends, and a trend stays in place until there is clear evidence that it has ended.
If you are new to charts, learn technical analysis first so these trend terms feel easy.
Elliott Wave Theory Explained in Simple Words
Ralph Nelson Elliott studied market charts in the 1930s and noticed that prices seemed to move in repeating patterns. He linked those patterns to waves of optimism and pessimism in the crowd.
In Elliott wave theory, a trend moves in five waves with the trend, followed by three waves against it.
Traders often pair these waves with ratio tools, for example Fibonacci levels used inside Elliott waves.
Primary Trends or Impulse Waves: Which Market Structure Wins?
Both theories split a big move into smaller parts. However, the labels and the logic are different.
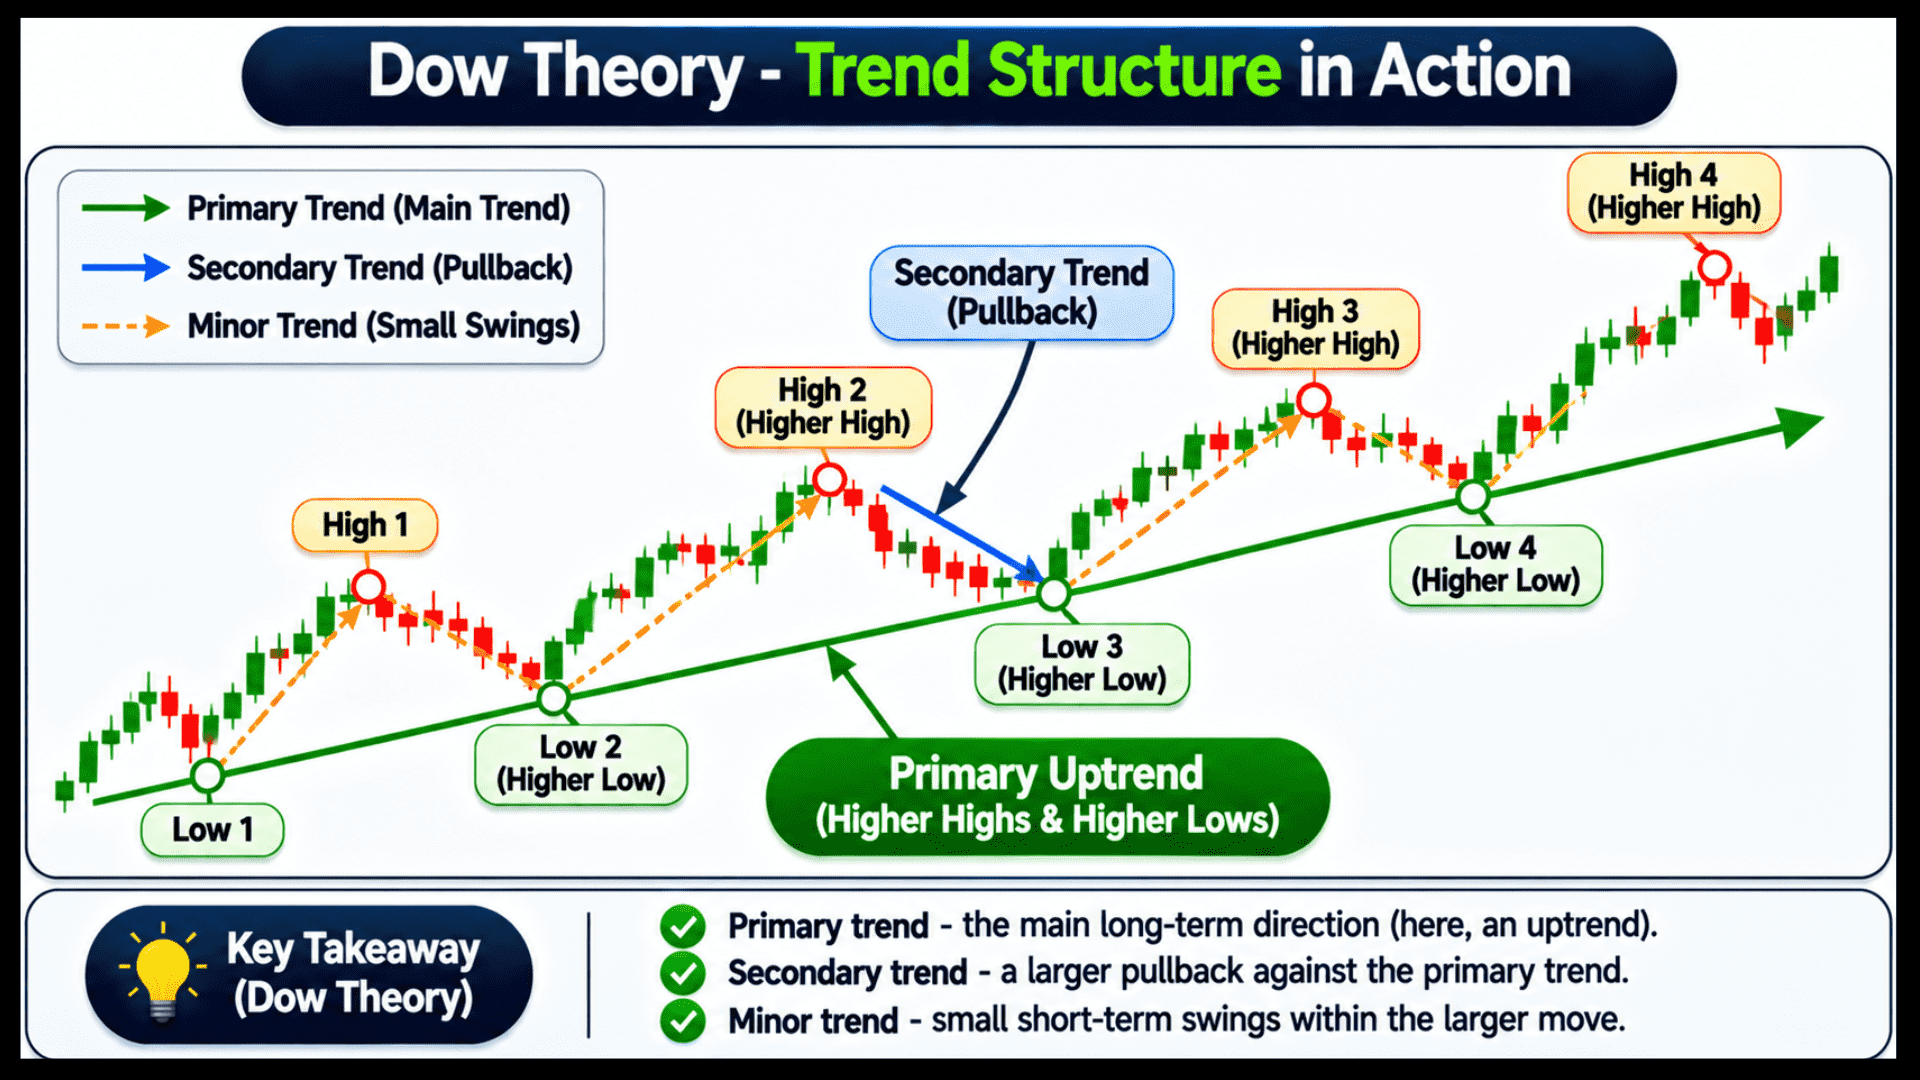
Dow theory uses three layers of trend. Elliott wave uses two types of waves, repeated at many sizes.
The table below puts the two structures next to each other.
| Point | Dow Theory | Elliott Wave |
|---|---|---|
| Main building block | Primary, secondary and minor trends | Impulse and corrective waves |
| Big move | Primary trend, lasting months to years | Five-wave impulse in the trend direction |
| Counter move | Secondary trend, a pullback inside the primary trend | Three-wave correction (A, B, C) |
| Smaller moves | Minor trend, lasting days to weeks | Smaller waves inside each wave (fractal) |
| What defines the trend | Higher highs and higher lows (or the reverse) | Wave count and a few fixed rules |
So in Dow theory, a secondary trend is just a healthy pause inside the primary trend. In Elliott wave, the same pause becomes a corrective wave with its own A, B, C shape.
Each five-wave and three-wave shape forms an Elliott wave chart pattern that you can spot on the chart.
Many traders also add a simple filter, such as a 20 and 50 EMA crossover, to check the broader trend side.
How Does Each Method Confirm a Trend?
Confirmation means checking that a trend is real before you act on it. Dow theory and Elliott wave do this in two very different ways.
Dow theory looks for agreement between market signals, such as two averages and volume. Elliott wave looks for a valid wave count that follows fixed rules.
Below, we explain each method’s confirmation step by step. After that, you can judge which one feels easier to apply.
How Does Dow Theory Confirm a Trend?
Dow theory asks for proof from more than one place. In its classic form, two related market averages should make new highs or new lows together.
Volume is also expected to support the trend. Volume should rise when price moves with the trend and ease off during pullbacks.
Short-term traders often read trend strength with one line, like in this 9 EMA strategy.
How to Confirm an Elliott Wave: Rules & Invalidation
Elliott wave does not wait for a second index to agree. Instead, it relies on Elliott wave rules. For example, wave 2 cannot retrace past the start of wave 1.
If a rule breaks, the count is wrong and needs a rethink. That rule-break is the confirmation (or the cancellation) in this method.
The list below shows what each method usually wants to see before you trust a move.
- Dow theory: two averages agreeing, volume supporting, and a clear swing break.
- Elliott wave: a count that follows the wave rules, and price staying beyond key invalidation levels.
Which Is More Subjective: Elliott Wave or Dow Theory?
Honestly, Elliott wave is the more subjective one. Two analysts can label the same chart differently.
Dow theory has its own debates, but it relies on simpler things. Swing highs, swing lows and volume are easier to point at on a chart.
Here is a quick view of where each method leaves room for opinion.
- Wave labelling: in Elliott wave, whether a move is wave 3 or wave C can change the whole plan.
- Degree of trend: in Dow theory, deciding if a fall is a secondary or a primary trend takes judgement.
- Late signals: Dow theory often confirms a trend only after a good part of it has moved.
So Elliott wave users must respect invalidation levels. If the count fails, you leave.
Which Timeframe Works Best For Elliott Wave or Dow Theory?
Both ideas can be applied on any timeframe, but each has a natural home. The practical question is how fast you need an answer.
Dow theory fits weekly and daily charts well, because its primary trend runs for months or years. Elliott wave works on everything from a 5-minute chart to a monthly chart, since waves repeat in smaller sizes.
That flexibility cuts both ways, because counting gets noisy on very short charts. Beginners should first learn how to use Elliott wave on daily and weekly charts.
Not sure about your holding period? Compare intraday vs delivery trading first.
Elliott Wave vs Dow Theory Comparison Table
If you want everything in one place, this table covers the seven main differences. Use it as a quick revision sheet.
| Feature | Dow Theory | Elliott Wave |
|---|---|---|
| Origin | Charles Dow, late 1800s | Ralph Nelson Elliott, 1930s |
| Core idea | Trends persist until clear reversal | Crowd psychology moves in repeating waves |
| Trend structure | Primary, secondary, minor | Impulse and corrective waves |
| Confirmation | Averages agree, volume supports | Wave rules hold, invalidation not broken |
| Subjectivity | Moderate | High, labelling can differ |
| Typical timeframe | Weekly and daily | Any timeframe |
| Best for | Trend direction and market health | Timing, structure and risk levels |
Notice that neither column says “better”. They answer different questions, which is why many traders end up using both.
Which Suits You Better: Elliott Wave or Dow Theory?
Your style and patience matter more than the theory. A method that does not fit your routine will not last.
Dow theory suits people who want a calm, big-picture view of the market. Elliott wave suits people who enjoy chart detail and are happy to review a count often.
It also helps to know the types of investors in the stock market and their habits.
The table below maps common trader types to the method that usually fits their routine.
| Trader type | Likely fit | Why |
|---|---|---|
| Long-term investor | Dow theory | Primary trend gives direction without daily work |
| Swing trader | Both | Dow for bias, Elliott for entry and exit zones |
| Short-term trader | Elliott wave | Waves repeat on small charts and give clear invalidation |
| Beginner | Dow theory first | Simpler rules, easier to practise |
This is for learning, not a rule. Test on past charts before you rely on any method.
Traders, investors and speculators think differently, as investor vs trader vs speculator explains.
Can You Use Elliott Wave and Dow Theory Together?
Yes, and this is how many chart readers actually work. They use Dow theory to decide the direction and Elliott wave to decide the entry.
Whether you are a beginner or an active trader, you can blend both ideas without cluttering your chart. Start small and practise on past data.
The steps below show one way to combine them on a practice chart.
- Mark the primary trend using swing highs and lows.
- Wait for a secondary pullback and see if it looks like a three-wave correction.
- Note the level where the count would be wrong, and plan your stop loss there.
- Check volume and the other average (or a related index) for confirmation.
For the wave side in more detail, see these Elliott wave strategies for trading.
Reading alone does not build skill. Real clarity comes from practising on live charts and getting your doubts solved by a mentor.
In our live technical analysis classes of 1 to 1.5 hours, you can join from your mobile, ask questions and learn step by step. There is no fixed batch to wait for. We do not promise profits, we help you build skill.
Conclusion
Elliott wave vs dow theory is not a contest with a single winner. Dow theory gives you direction and confirmation, while Elliott wave gives you structure and timing.
Dow theory is simpler, so it suits beginners and long-term investors. Elliott wave adds detail, but it is also more subjective.
Start with Dow-style trend reading, then add Elliott wave for entries and exits. Always keep your invalidation level clear, and use a stop loss on every trade.
Finally, test both methods on past charts before using real money. With practice, you will see which one fits your style.
Frequently Asked Questions
Before investing capital, invest your time in learning Stock Market.
Fill in the basic details below and a callback will be arranged for more information: