

Ever looked at a price chart and thought, “This can’t be random”? You are not wrong. Markets move in waves. Not perfectly. Not neatly. But repeatedly.
If you want to understand how to use the Elliott wave, you need to see the market as a rhythm. Price expands, corrects, expands again.
Fear and greed leave footprints. Elliott Wave Theory simply organizes those footprints.
Let us explain clearly and practically.
What Are Elliott Waves?
Before applying Elliott Wave analysis, it helps to understand its basic structure.
The theory says markets move in repeating cycles of trend waves and correction waves driven by crowd psychology.
A complete Elliott wave formation has five impulsive waves that move with the main trend, followed by three corrective waves that move against it.
Traders study this 5-3 rhythm to anticipate where the next move may appear on the chart.
| Wave Type | Structure | Role |
| Impulse | 5 Waves (1-2-3-4-5) | Moves with the trend |
| Correction | 3 Waves (A-B-C) | Moves against the trend |
Elliott Wave Rules
Elliott Wave analysis becomes practical only when traders know exactly when their wave count is invalid.
These three non-negotiable rules act as a logical framework for placing stop losses and exiting wrong trades.
Keeping an Elliott wave cheat sheet nearby during live market hours ensures you never ignore these critical structural breaks.
Using these rules, your exit strategy is no longer a guess; it’s a mathematical necessity triggered the moment the pattern is proven wrong.
- Wave 2 cannot break below the Wave 1 Start: If the price drops below the beginning of Wave 1, the impulse count is invalid.
- Wave 3 cannot Be The Shortest Impulse Wave: Wave 3 must show strong momentum compared to Waves 1 and 5.
- Wave 4 Cannot Enter Wave 1 Territory: If Wave 4 overlaps Wave 1, the impulse structure is broken.
How To Use Elliott Wave Theory Step By Step?
Now we get practical. Here is how to use the Elliott wave on a live chart.
Step 1: Identify The Overall Trend
Start with higher timeframes like 1 hour, 4 hours, or daily.
Ask:
- Is price making higher highs and higher lows?
- Or lower highs and lower lows?
Impulse waves move with the trend. So you must know the trend first.
Step 2: Mark The 5 Wave Structure
Once the trend is clear, you can begin to plot the Elliott Wave Chart Pattern on your screen. This involves identifying the specific swings that make up the impulsive phase.
Look for:
- Wave 1: initial breakout
- Wave 2: pullback
- Wave 3: strong expansion with volume
- Wave 4: consolidation
- Wave 5: final push
Wave 3 often extends the most. If Wave 3 is tiny, your count is probably wrong.
Step 3: Wait For ABC Correction
After 5 waves are complete, expect a 3 wave correction.
This is where many traders panic.
But this is normal market breathing.
Very often, this pullback takes the form of a sharp zigzag correction pattern, which quickly retraces the previous gains before the next cycle begins.
How To Use Elliott Wave Indicator And Oscillator?
Manually counting waves takes practice. Indicators help confirm your count and show you how to do Elliott Wave analysis with more technical accuracy.
Most trading platforms offer automatic Elliott Wave indicators. These try to label waves for you.
But here is the truth. They are guides, not gospel.
Use them to:
- Spot possible wave counts.
- Confirm manual analysis.
- Detect impulsive structures.
Never trade blindly based on auto-labeling.
On the other hand, the Elliott Wave Oscillator is typically the 5-period simple moving average of closing prices minus the 34-period simple moving average of closing prices.
It helps identify:
- Strong Wave 3 momentum
- Divergence in Wave 5
When Wave 3 forms, the oscillator shows the strongest peak. If Wave 5 makes a new price high but the oscillator is weaker, that is divergence. Correction may follow.
How To Use Elliott Wave On LuxAlgo?
Many retail traders today use LuxAlgo on TradingView to simplify Elliott Wave analysis.
LuxAlgo provides indicators that automatically detect impulse and corrective zones, which help traders visualize wave structures faster.
It does not replace manual wave counting, but it works well as a confirmation tool when you analyze charts.
Simple way traders use it:
- Add the LuxAlgo indicator on a TradingView chart.
- Let it highlight possible impulses and corrective waves.
- Compare the signals with your manual Elliott Wave count.
- Use it with support, resistance, and volume to confirm trade setups.
How To Use Elliott Wave And Fibonacci Together?
This is where things get powerful.
Elliott Wave works best with Fibonacci ratios.
Common relationships:
- Wave 2 retraces anywhere between 38.2% to 78.6% of Wave 1 with 50% and 61.8% being the most frequent levels
- Wave 3 often extends 1.618 times Wave 1
- Wave 4 retraces 38.2 percent of Wave 3
- Wave C equals Wave A in many corrections but it can also extend to 1.618× Wave A.
Example:
If Wave 1 moved 100 points, Wave 3 often moves around 161 points.
Fibonacci gives measurable targets. Elliott gives structure. Together, they create probability.
Want to master how to use Elliott Wave like a pro? Download the Stock Pathshala app now and join our detailed trading sessions to sharpen your edge.
Entry, Stop, And Exit: How To Use Elliott Wave For Actual Trade Setups?
Understanding the wave structure is useful, but traders really care about where to enter and where to exit, because this is where Elliott Wave strategies for trading become practical.
In practice, the best entries usually occur at the start of impulse waves, when momentum begins building.
Corrective waves such as Wave 2 and Wave 4 often create the best risk-to-reward setups because they allow traders to join the trend before the next impulse leg begins.
| Trade Setup | Entry Trigger | Stop Level | Target |
| Wave 3 Trade | Enter after Wave 2 completes and price breaks the Wave 1 high with strong momentum | Below Wave 2 low | End of Wave 3 extension |
| Wave 5 Trade | Enter after Wave 4 sideways correction when price breaks the Wave 3 high | Below Wave 4 low | Near Wave 5 completion |
| Wave C Trade | Enter when Wave B ends and price breaks the Wave A low/high, depending on direction | Above Wave B high | Equal to Wave A length or end of Wave A |
This structured approach helps traders plan clear entries, stops, and targets instead of guessing the next move.
How To Use Elliott Wave For Intraday Trading?
Intraday traders often ask, “Can this work on 5-minute or 15-minute charts?
Yes. But with discipline.
Here are the steps to use Elliott wave for intraday trading:
- Focus on 15 minutes or 1 hour for the wave context.
- Trade Wave 3 or Wave C only.
- Avoid trading inside the Wave 4 chop.
Wave 3 intraday trades are gold. They are fast and directional.
Example:
Nifty breaks resistance. That is likely Wave 1. Small pullback forms Wave 2. Once price breaks Wave 1 high with volume, that is early Wave 3 entry.
Stop below Wave 2 low.
Let’s understand this better by taking one example.
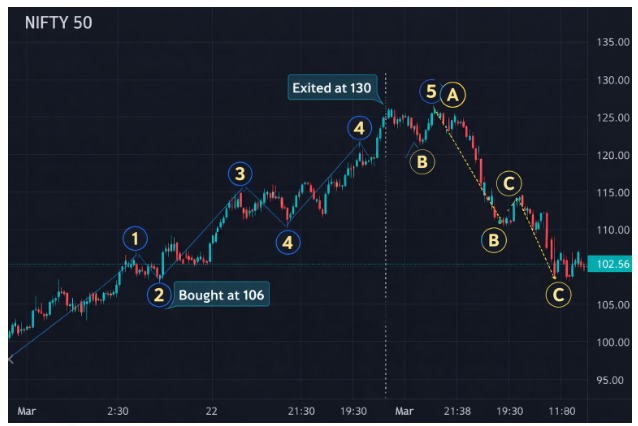
Look at the stock in the above image moving from 100 to 120.
- Wave 1: 100 to 110
- Wave 2: Pullback to 105
- Wave 3: 105 to 130
- Wave 4: Pullback to 122
- Wave 5: 122 to 135
Then correction:
- A: 135 to 120
- B: 120 to 128
- C: 128 to 110
If you bought near 106 during Wave 2 and exited near 130 in Wave 3, that is high probability trading.
See the difference? You are not guessing. You are following the structure.
Common Mistakes Traders Make While Using Elliott Wave
Let us be honest. Elliott Wave can confuse beginners, especially when charts become messy, and multiple counts seem possible.
It is a very strong theory, yet it can be effective only if the traders use it in a disciplined form.
The following are some of the mistakes that are usually made and the way they appear practically.
- Forcing Wave Counts
What it looks like: calling a simple three wave move a five wave movement because you think that the market is going to trend.
What to do: where rules have been broken on the waves, move back and label again at the big swing point. - Ignoring Invalidation Rules
What it looks like: holding a trade even after price breaks below the Wave 2 low in an impulse setup.
What to do: treat rule violations as a clear exit signal and close the trade instead of hoping the pattern will recover. - Trading Every Wave
What it looks like: trying to capture every small wave on lower timeframes and ending up overtrading choppy moves.
What to do: focus mainly on Wave 3 or Wave C setups where momentum and probability are stronger. - Skipping Fibonacci Confirmation
What it looks like: you could simply place trades without examining typical levels of retracement of 38.2 percent or 61.8 percent.
What to do: Fibonacci levels should be used to prove whether the wave structure is typical of the retracement.
The best trading decision is sometimes just a simple one. When the number of waves becomes confusing, back up and wait until one can see that there is structure. Consistency often comes from knowing when not to trade.
Conclusion
Learning how to use the Elliott wave is not about predicting every tick. It is about understanding market rhythm.
Impulse. Correction. Expansion. Pause.
Markets breathe like people. When you learn to read that rhythm, trading becomes less chaotic.
It takes screen time. It takes practice. But once you start seeing waves clearly, charts feel less random and more structured.
And honestly, that clarity changes everything.
Ready to move from guesswork to professional market analysis?
Join our stock market courses today at Stock Pathshala. We’ll help you master these wave structures through practical, live-market examples so you can trade with true structure and discipline.
FAQs
Q1: Does Elliott Wave Really Work In Trading?
Ans: In reality, yes, it works when it is used with rigid rules and confirmation techniques, such as Fibonacci and momentum indicators.
It is not a flawless predictor, but it assists in determining areas of high probability of trend continuation and reversal.
Q2: How Do Beginners Start Using Elliott Wave?
Ans: Start by learning the basic 5-wave impulse and 3-wave correction structure on higher timeframes.
Practice marking waves manually before relying on any Elliott Wave indicator or automated tool.
Q3: Can Elliott Wave Be Used For Intraday Trading?
Ans: Yes, many traders use it on 15-minute and 1-hour charts to trade Wave 3 or Wave C moves.
The key is combining wave count with volume, structure breaks, and proper stop loss placement.
Before investing capital, invest your time in learning Stock Market.
Fill in the basic details below and a callback will be arranged for more information:


