
Markets do not move in straight lines, and that confusion is exactly what costs traders money. You watch a rally, wonder if it has legs, then hesitate. By the time you decide, the move is over.
The Elliott wave chart pattern removes that guesswork.
Developed by Ralph Nelson Elliott in the 1930s, this technical framework reveals how crowd psychology creates repeating price cycles.
Thus, giving you a structured way to anticipate what the market does next, not just react to it.
In this guide, you will learn what the Elliott wave chart pattern is, the different types, how to read Elliott Wave on a live chart, and which indicators help confirm your wave count.
What Is An Elliott Wave Chart Pattern?
Before we go deeper, let’s answer the obvious question.
The Elliott wave chart pattern is a technical structure that explains price movement as a repeating cycle of five impulsive waves followed by three corrective waves.
It follows a simple rhythm:
- 5 waves move with the trend
- 3 waves correct against the trend
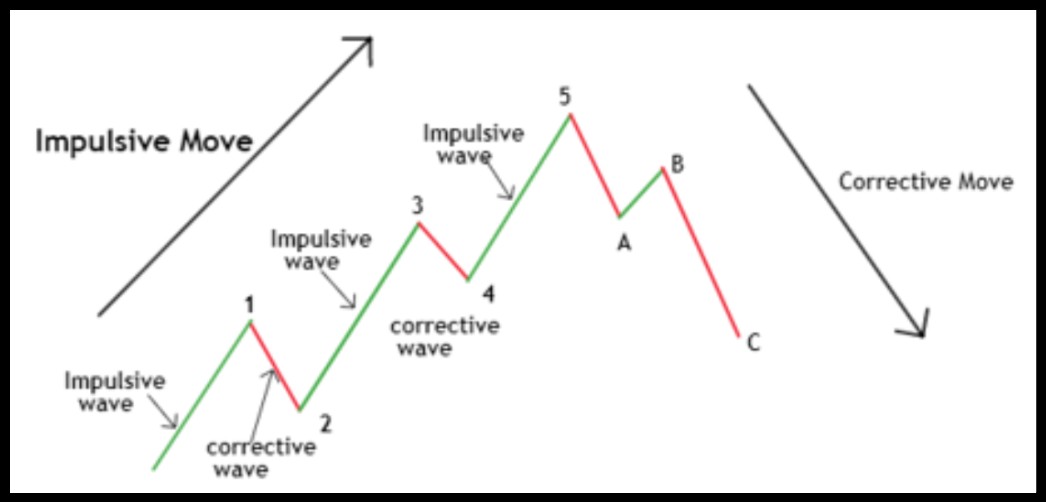
In the image, you can clearly see:
- Waves 1 to 5 form an impulsive move
- A corrective ABC structure afterward
That 5-3 structure is the backbone of Elliott Wave theory. Now, let’s have a look at different types of Elliott wave chart patterns to understand the concept well.
Types of Elliott Wave Chart Patterns Explained
The chart in the image highlights five main structures. Understanding the types of Elliott wave chart patterns helps you avoid confusion.
Once you can distinguish between these formations, learning how to use Elliott Wave theory in live markets becomes much more intuitive because you are no longer guessing the trend.
1. Motive Wave Patterns
Motive wave patterns move in the direction of the main market trend and represent the phase where price expands with momentum.
This category includes impulse waves and diagonal waves, which differ in internal structure, but both push the trend forward.
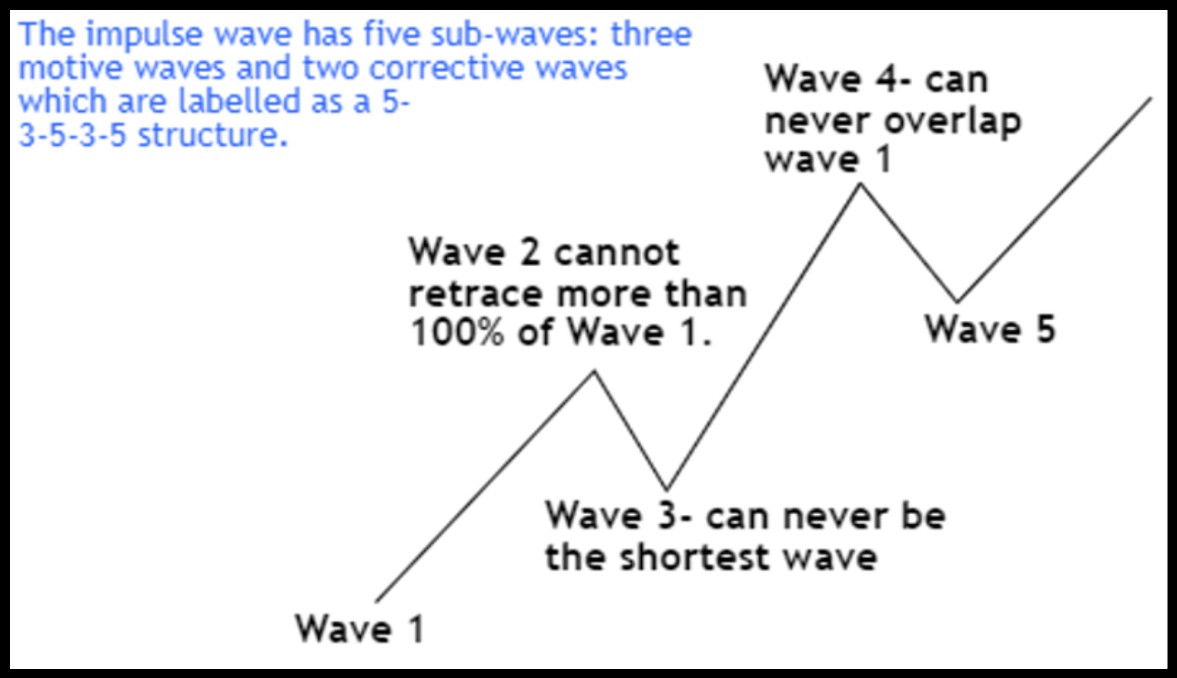
Impulse waves move strongly in the direction of the main trend.
Rules visible in the image:
- Wave 2 cannot retrace more than 100 percent of Wave 1
- Wave 3 cannot be the shortest
- Wave 4 cannot overlap Wave 1
This is the engine of the market. In the Bitcoin example shown, the numbered 1 to 5 structure represents this impulsive sequence.
- Diagonal Pattern
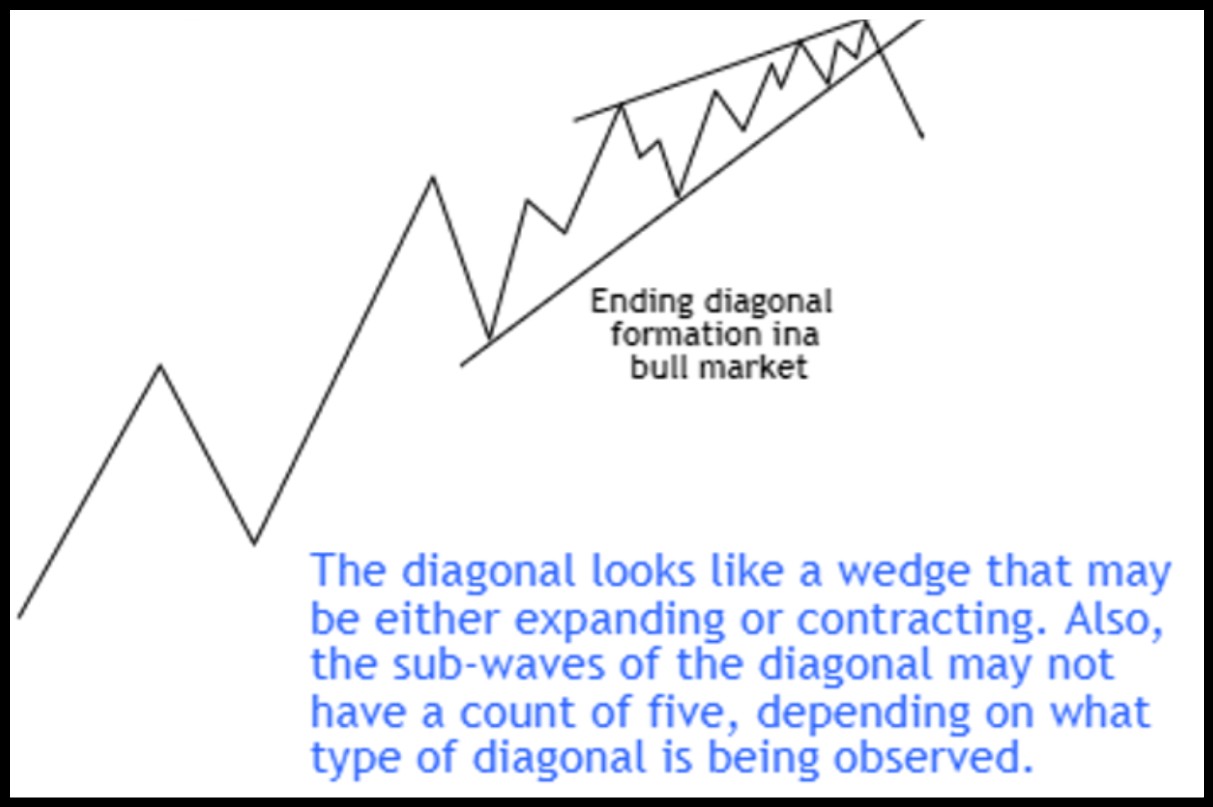
The image shows a wedge-shaped formation.
This appears either at the beginning or end of a trend. It looks compressed, with overlapping waves. Ending diagonals often signal exhaustion.
2. Corrective Wave Types
Corrective wave patterns move against the main trend and represent the market’s pause or consolidation phase.
These patterns include zigzag, flat, triangle, and combination formations, which help the market reset before the trend continues.
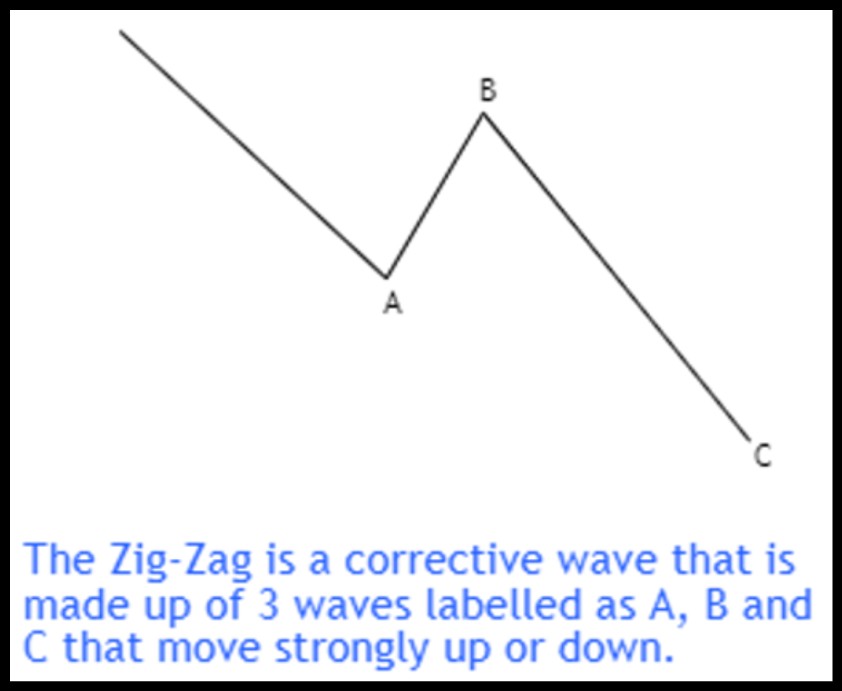
In the image, you see a sharp ABC correction.
Structure:
- 5 waves down in A
- 3 waves up in B
- 5 waves down in C
This correction is aggressive. It moves the price strongly against the previous trend.
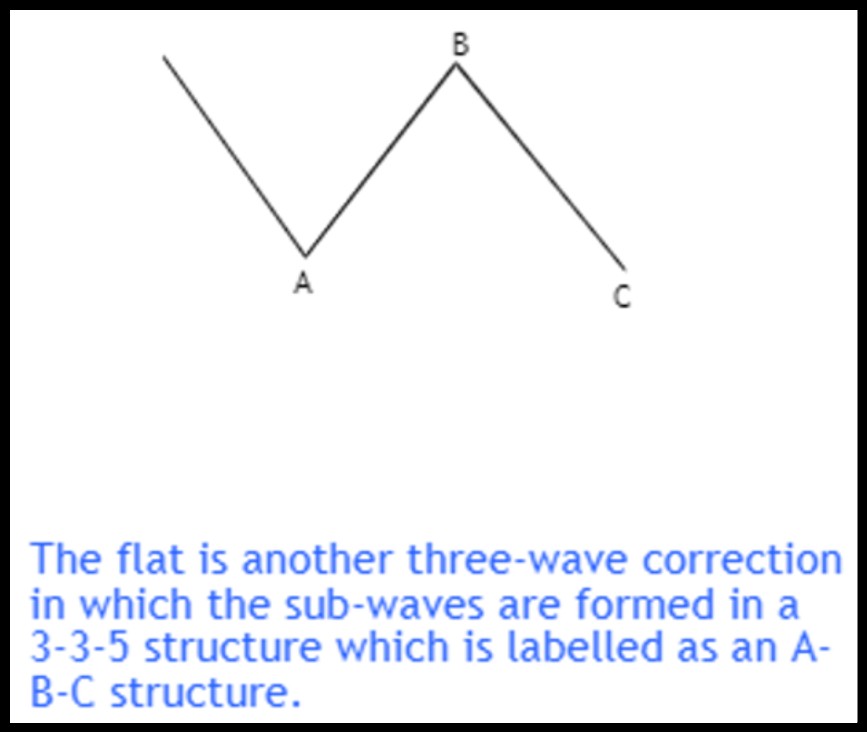
The Flat structure shown in the image moves sideways.
It follows a 3-3-5 formation:
- Wave A in 3
- Wave B in 3
- Wave C in 5
Flats signal consolidation rather than panic selling.

The image shows five overlapping waves labeled A, B, C, D, and E.
Triangles contract price action. They usually appear in Wave 4 or Wave B before a breakout.
- Combination Corrections (W-X-Y)
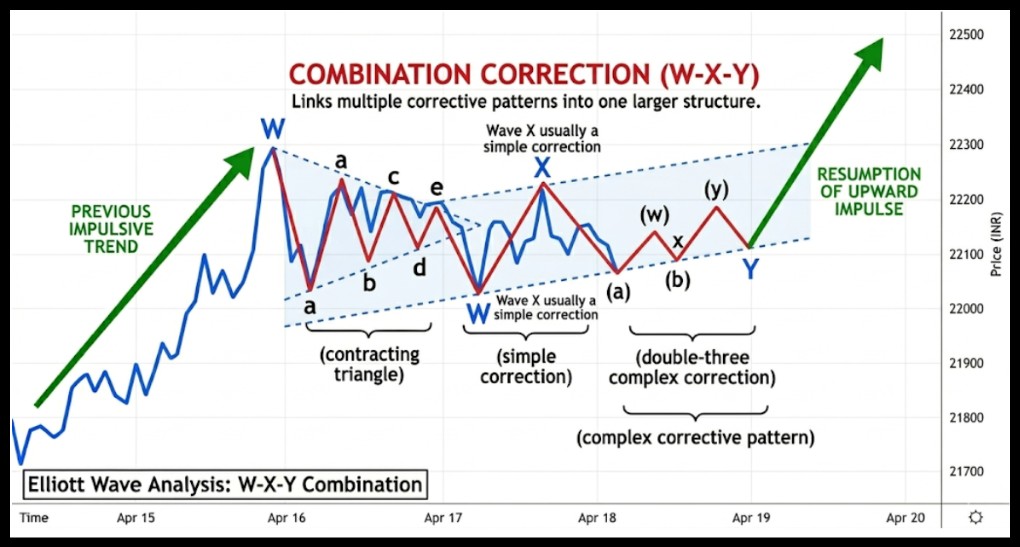
Combination corrections, labeled W-X-Y or W-X-Y-X-Z, link multiple corrective patterns into one larger structure. These often appear during complex market pauses.
One important principle is that of alternation: in an impulse trend, both Wave 2 and Wave 4 tend to be different in style.
With a sharp Wave 2, being zigzag, Wave 4 tends to become sideways, like a flat or combination.
Each structure plays a specific role in the overall Elliott wave chart pattern cycle. Now that you know the structures, here’s how to spot them on a live chart.
How To Do Elliott Wave Analysis?
Now comes the practical part. Knowing patterns is one thing. Reading them live is another.
When you begin developing Elliott Wave strategies for trading, you must move beyond just looking at a pretty picture and start verifying the data.
Here’s how to read Elliott wave chart patterns effectively:
Step 1: Identify The Trend
Always begin your analysis on a higher timeframe, such as the daily or weekly chart. This gives you the bigger picture before you zoom in on smaller moves.
The larger upward move is where your impulse 1 to 5 structure will form.
Ask yourself:
- Is price making higher highs and higher lows? This confirms that the broader trend is intact and an impulse sequence is likely developing.
- Is Wave 3 extended?: Wave 3 is usually the strongest and longest wave in the entire sequence. It should stand out clearly on the chart with strong momentum and volume behind it.
If Wave 3 appears weak or similar in size to Wave 1, pause and rethink your count entirely. A weak Wave 3 is one of the earliest signs that your labeling may be off.
Step 2: Apply The Rules Strictly
Impulse rules are non-negotiable. If any of these break, your wave count is wrong and must be restarted:
- Wave 4 must not overlap Wave 1: If Wave 4 retraces into the price territory of Wave 1, the structure is no longer a valid impulse.
- Wave 3 cannot be the shortest: Among Waves 1, 3, and 5, Wave 3 must never be the smallest in length.
- Wave 2 cannot retrace beyond Wave 1’s origin: If Wave 2 retraces 100 percent or more of Wave 1, the impulse is invalidated.
These are not flexible guidelines you adjust based on how the chart looks. They are hard structural rules. The moment one breaks, stop forcing the count and go back to a different swing point.
Step 3: Watch The Correction
After Wave 5 completes, expect an A B C correction. Corrective structures follow the impulse.
Understanding the Elliott Wave ABC correction rules helps you distinguish between a temporary pullback and a full trend reversal.
Recognizing whether it is a Zig Zag, Flat, or Triangle helps forecast the next move.
For example:
- Sharp drop? Likely Zig Zag: A steep and aggressive decline after Wave 5 usually signals a Zig Zag correction, where price moves sharply against the prior trend in an A-B-C sequence.
- Sideways drift? Possibly Flat: When price moves horizontally without a strong directional push, a Flat correction is forming, signaling consolidation before the next impulsive move begins.
- Contracting swings? Triangle: If each successive swing is smaller than the last and the price is tightening into a narrow range, you are likely watching a Triangle correction develop before a breakout.
Note: The correction is likely complete when:
- Wave C reaches a common Fibonacci level
- Volume starts expanding in the new trend direction
- A momentum indicator like RSI shows bullish divergence.
Best Indicators to Confirm Elliott Wave Chart Patterns
Many traders wonder if an Elliott wave chart pattern indicator can automatically label waves and simplify analysis. The idea sounds appealing.
Load a chart, add an indicator, and let the software identify every wave for you.
Platforms like TradingView provide Elliott Wave drawing tools, and several custom scripts attempt automatic wave labeling.
These tools can help highlight possible wave counts and structures on the chart.
However, there is an important reality that traders learn quickly.
- Indicators assist
- They do not replace manual validation
Each indicator helps validate different phases of the wave cycle. When multiple signals align with the wave count, the setup becomes more reliable.
|
Indicator |
Wave It Confirms |
What To Look For |
|
RSI |
Wave 3 and Wave 5 | RSI above 70 often appears during Wave 3 momentum. RSI divergence in Wave 5 can signal trend exhaustion. |
| MACD | Wave 3 strength |
Wave 3 typically produces the highest MACD histogram peak. Wave 5 often shows a smaller peak, creating bearish divergence. |
|
Volume |
Impulsive waves |
Volume is usually strongest during Wave 3, then declines through Wave 4 and Wave 5 before increasing when the correction begins. |
|
Fibonacci Tool |
All wave projections |
Traders use Fibonacci retracement and extension levels to estimate Wave 3 targets and correction depths. |
Let’s have a look at a practical example of Elliott wave chart pattern:
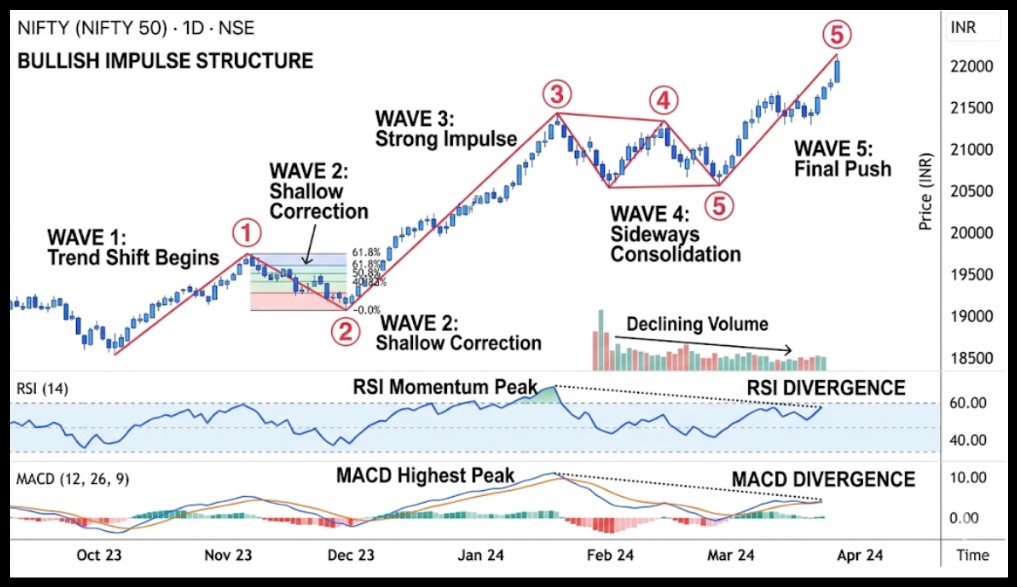
Consider the above typical bullish impulse forming on the chart.
- Wave 1 begins the trend shift.
- Wave 2 retracts based on Fibonacci levels, including 50 percent or 61.8 percent.
- Wave 3 may have good RSI momentum and maximum MACD.
- Wave 4 is progressive, but deteriorates in volume and moves on a sideways track.
- Wave 5 can either reveal divergence in RSI or the MACD, which implies that the trend is not gaining strength.
This combination of tools helps traders confirm whether the wave structure is valid.
Conclusion
The Elliott wave chart pattern is one of the few technical tools that gives you both structure and context. It does not just tell you where the price is, but it tells you where the price is likely to be within a larger cycle.
The key is discipline. Follow the three core impulse rules without exception. Use indicators like RSI, MACD, and Fibonacci as confirmation, not direction.
And when a count breaks a rule, do not force it and restart the analysis.
You might be wondering, How long does it take to learn Elliott Wave effectively? There is no overnight shortcut, but with consistent practice, you can begin spotting major trends in just a few weeks.
Start small, pick one past chart, identify the dominant trend, and practice labeling the five-wave impulse. Once you can consistently spot Wave 3, the rest of the count will begin to fall into place naturally.
The market will always have rhythm. Elliott Wave simply teaches you how to listen to it.
If you want to learn how to apply Elliott Wave concepts on real charts without confusion, join our live stock market classes, where we break down wave structures step by step using live market examples.
FAQs
Q1: Is the Elliott wave chart pattern trustworthy?
Ans: Yes, it is reliable when rules are applied strictly. It works best on higher timeframes with strong trending markets, where wave structures are cleaner and easier to identify.
Q2: Is it possible to use an Elliott wave chart pattern indicator by beginners?
Ans: Beginners can use indicators as a starting point, but manual rule validation is essential. Relying solely on automated labeling without understanding the rules will lead to incorrect wave counts.
Q3: What is the most common pattern?
Ans: The impulse wave is the most common in trending markets. During pullbacks, Zig Zag and Flat corrections appear most frequently, making them the patterns traders encounter most often.
Before investing capital, invest your time in learning Stock Market.
Fill in the basic details below and a callback will be arranged for more information:


