

Most traders use five indicators and still cannot decide whether to buy or sell. More tools rarely mean better decisions; they usually mean more confusion and more losses.
The EMA and Supertrend strategy changes completely. It gives you exactly two tools, one for direction and one for timing, and nothing else cluttering your chart.
No second-guessing, conflicting signals. No staring at the screen, wondering which indicator to trust this time.
When EMA and Supertrend align, the trade is clear. When they disagree, you simply do not trade. That one rule alone eliminates a large percentage of bad entries before they happen.
If you have been searching for a strategy that is simple enough to follow under pressure but reliable enough to trade consistently, this is exactly what you need.
What Is EMA And Supertrend Strategy?
Before applying it, you need to understand the logic behind this combination. It blends a volatility-based indicator with a moving average.
- EMA determines the direction of trends
- Supertrend shows when to enter and exit.
How Every Indicator Operates:
- EMA tracks price closely, smoothing out minor fluctuations to show the underlying trend.
- Depending on the direction of the trend, the Supertrend changes colour.
When both align, the probability of a successful trade increases. Each indicator functions on its own.
They filter noise together. Traders use this combination widely because it balances speed with confirmation.
What Is The Supertrend Indicator?
You must understand how the Supertrend truly works before integrating it with EMA. Without understanding why, signals like ‘Supertrend turning green’ can feel arbitrary.
The Average True Range (ATR) was used to create the Supertrend, a volatility-based indicator.
Depending on the direction of the market, it plots a line above or below the price, assisting traders in spotting trend changes and successfully managing risk.
How Supertrend Works:
- Measures market volatility using ATR (default period 10).
- Creates a dynamic pricing range by applying a multiplier, usually three.
- When the price closes above the line, it becomes green, indicating a positive indication.
- When the price closes below the line, it becomes red, indicating a negative indicator.
- Acts as dynamic support and resistance and is widely used as a trailing stop-loss tool.
This is what makes the Supertrend more than just a signal indicator. It adapts to price changes and volatility, helping traders stay in trends while protecting profits.
Why the Supertrend And EMA Combination Strategy Works?
Now that the basics are clear, let’s connect the dots. The Supertrend and EMA Combination Strategy works because it removes conflicting signals.
Core Logic:
- Trade only in the direction of the EMA
- Use Supertrend for entry timing
- Avoid trades when indicators disagree
Why Traders Prefer It:
- Reduces false signals
- Keeps trades aligned with the trend
- Works across multiple timeframes
There is a small contradiction here. More indicators usually create confusion, but in this case, two simple tools actually simplify your decisions.
EMA And Supertrend Trading Strategy Rules
Rules turn a setup into a system. Without them, results become inconsistent. Clear rules also prevent impulsive decisions when markets move fast.
Entry Rules:
- Buy when the price is above the EMA and the Supertrend turns green
- Sell when the price is below the EMA and the Supertrend turns red
- Wait for the candle to close for confirmation
Exit Rules:
- Exit when the Supertrend flips direction
- Trail stop along the Supertrend line
- Book partial profit near resistance or support
Risk Management Table:
|
Rule |
Explanation |
| Risk per trade |
1 to 2 percent |
|
Stop loss |
Below the Supertrend line |
| Target |
Minimum 1:2 risk-reward |
Trades remain organised when these guidelines are followed. Ignoring them frequently results in emotional choices.
Even the best setup falls apart when emotions take over.
1. Supertrend With EMA Buy And Sell Logic
This is where the strategy becomes actionable. The buy-sell setup of the EMA Supertrend is straightforward but efficient. This is where the strategy becomes actionable.
Buy Setup:
- Price above EMA
- Supertrend turns green
- Entry after a bullish candle
Sell Setup:
- Price below EMA
- Supertrend turns red
- Entry after a bearish candle
Example:
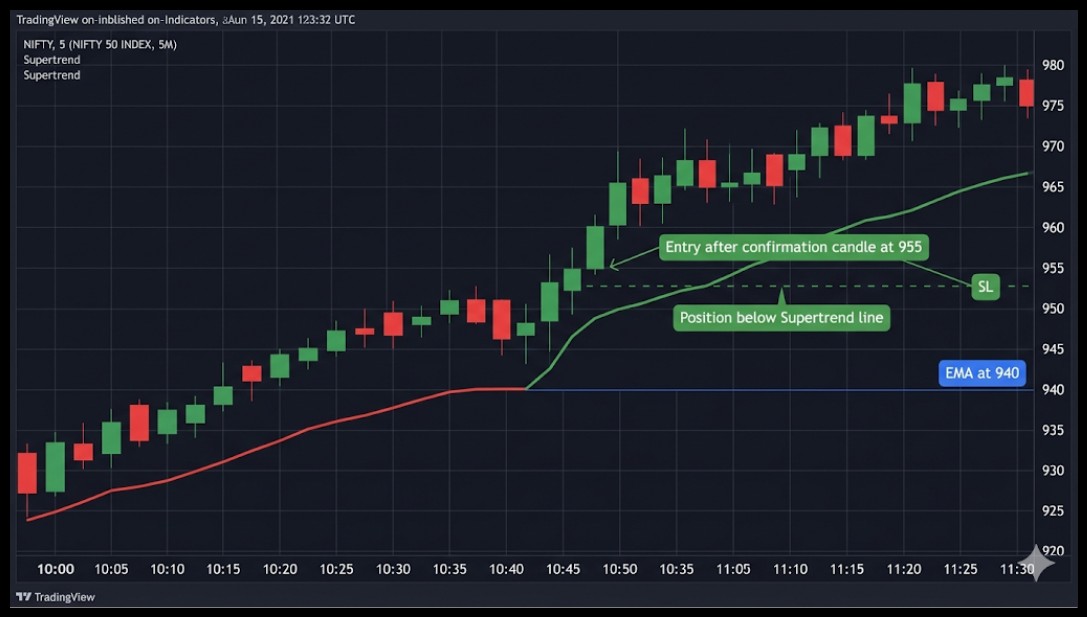
- Stock trading at 950
- EMA at 940
- Supertrend flips green
Entry after the confirmation candle at 955. The stop is positioned beneath the Supertrend line. This setup works because it aligns both momentum and trend direction at the same time.
2. The 200 EMA and Supertrend Combination
The 200 EMA + Supertrend setup provides a simple, rule-based strategy for traders seeking clarity without overanalysing.
It filters out noise while keeping you focused on the dominant market direction.
How The Setup Works:
- Price above 200 EMA → Only look for buy trades
- Price below 200 EMA → Only look for sell trades
- Enter when the Supertrend flips in the direction of the EMA
- Exit when Supertrend reverses, or price crosses 200 EMA
Example (Nifty Scenario):
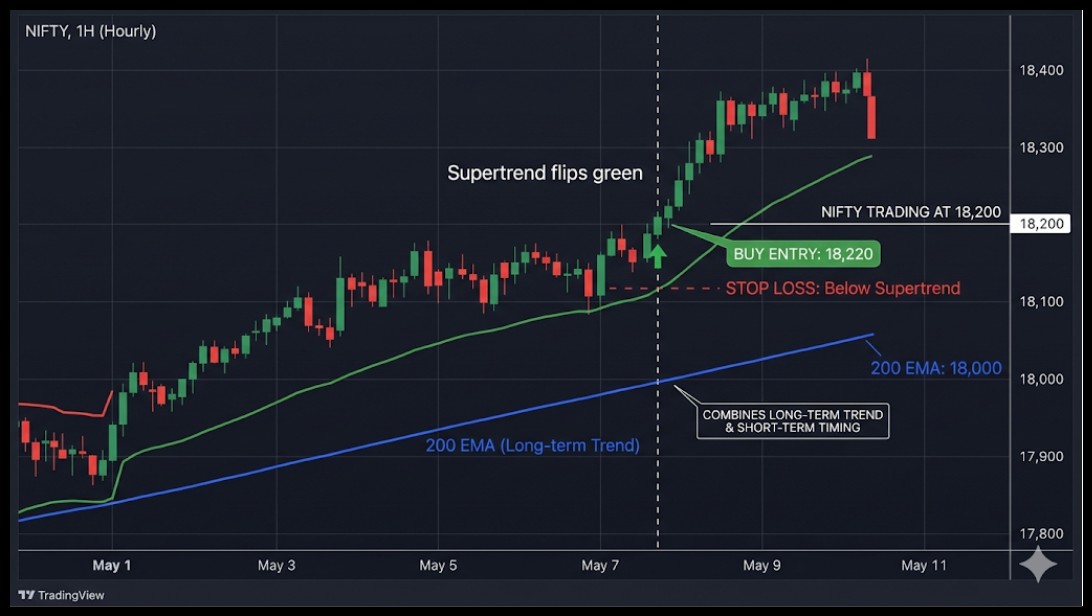
- Nifty trading at 18,200 above 200 EMA at 18,000
- Supertrend flips green
- Buy entry taken at 18,220 with stop below Supertrend
This combo uses Supertrend for exact timing while keeping trades in line with the larger trend. Over time, it improves trade quality and reduces false signals.
3. The 5/20 EMA Crossover and Supertrend Strategy
By combining momentum and trend, this Supertrend and EMA Combination Strategy lowers false entries.
It is widely used for intraday trading because an EMA crossover helps traders stay aligned with strong moves while filtering out weak signals.
For those looking for even faster momentum, the 5 EMA strategy can be used to capture quick price bursts as it hugs the candlestick closely.
How The Triple Confirmation Works:
- Buy when the 5 EMA crosses above the 20 EMA, and the Supertrend turns green
- Sell when the 5 EMA crosses below the 20 EMA, and the Supertrend turns red
- Ensure price is sustaining above or below both EMAs
- Wait for the candle to close to confirm the signal
Example:
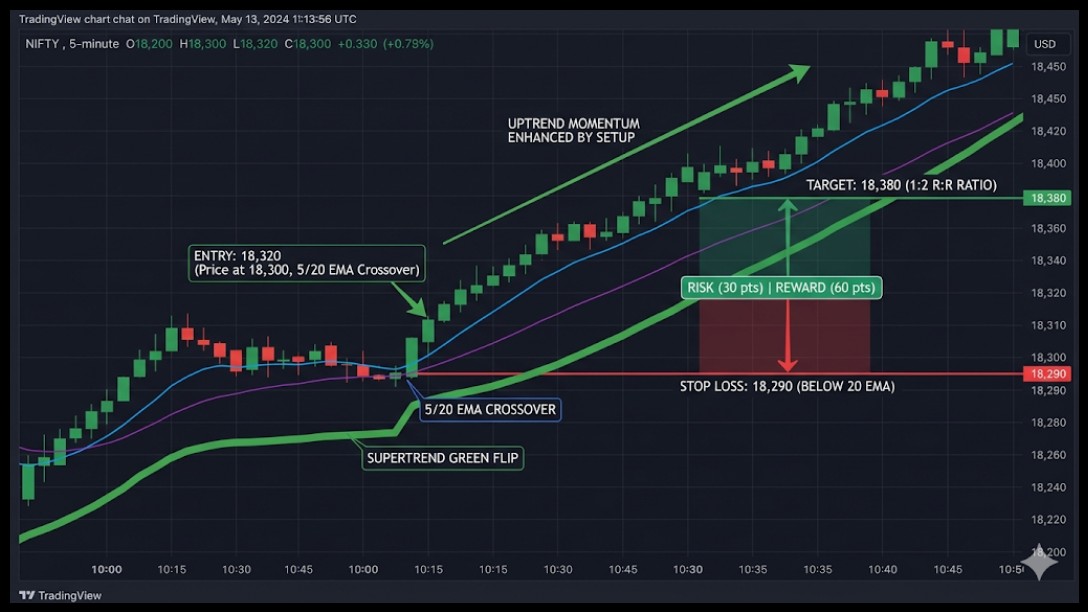
- Price at 18,300 on Nifty
- 5 EMA crosses above 20 EMA
- Supertrend flips green
Entry at 18,320 with a stop below 20 EMA and a target at a 1:2 risk-reward ratio.
By combining trend direction and momentum, this setup enhances trade quality. Over time, this reduces false signals and produces more reliable results.
Scalping Strategy With EMA And Supertrend
The Intraday Scalping Strategy with EMA and Supertrend is effective on shorter timeframes for quick traders. It captures fast momentum moves while keeping entries precise and exits controlled.
Many traders rely on the 9 EMA strategy for this purpose because it stays extremely close to the price action, making it ideal for spotting immediate trend shifts.
Best Setup:
- Timeframe: 1-minute or 5-minute
- EMA: 9 or 20
- Supertrend: default settings
Scalping Rules:
- Trade only in the EMA direction
- Enter immediately after the Supertrend flip
- Exit quickly with small targets
Example:
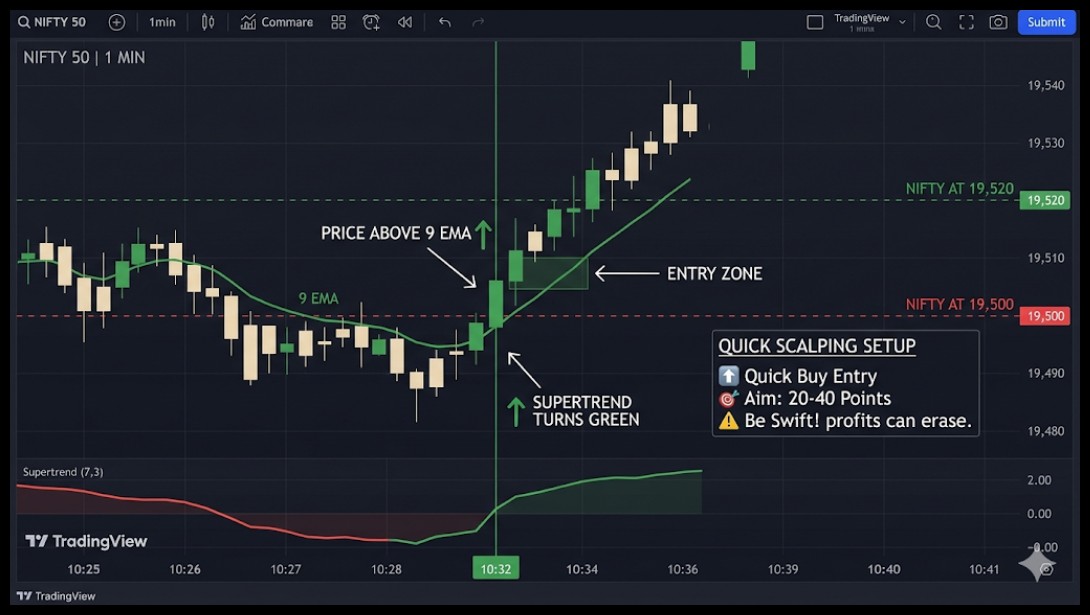
- Bank Nifty on 1-minute chart
- Price above 9 EMA
- Supertrend turns green
Quick purchase entrance with an aim of 20 to 40 points. Scalping seems quick, but discipline needs to be quicker. Hesitation can erase profits quickly.
Supertrend EMA Strategy TradingView Setup
The majority of traders chart and execute their Supertrend EMA technique using TradingView. It’s easy to set up.
You may concentrate on price activity and prevent needless complexity by using a simple chart configuration with few indicators.
How To Configure:
- Add EMA indicator (9, 20, or 50 based on style)
- Add Supertrend with default settings (10,3)
- Use a candlestick chart for clarity
What To Watch:
- EMA slope direction
- Supertrend color change
- Price reaction near EMA
TradingView makes this strategy easy to visualise. But tools cannot replace your judgment.
Your real edge comes from reading signals accurately and managing risk in the moment.
Supertrend Settings By Trading Style
Choosing the right Supertrend settings directly affects how sensitive your signals are; this is not optional.
Often, traders ask which time frame is best for the supertrend indicator, and the answer depends entirely on your trading objective.
The default settings work well, but adjusting them to match your trading style improves accuracy and reduces false signals.
Many professional traders also look for a 20 and 50 EMA crossover alongside the Supertrend to confirm a medium-term trend shift before entering.
Recommended Settings Table:
|
Trading Style |
ATR Period | Multiplier | Suggested EMA |
| Scalping | 7 | 2 |
9 EMA |
|
Intraday |
10 | 3 | 20 EMA |
| Swing Trading | 14 | 3 to 4 |
20 or 50 EMA |
|
Positional |
14 to 20 | 4 to 5 |
50 or 200 EMA |
Key Points To Remember:
- Default setting (10,3) works well across most markets
- Lower ATR and multiplier give faster signals, but more noise
- A higher multiplier reduces false signals in volatile markets
- Match Supertrend sensitivity with EMA timeframe
The right combination keeps your strategy balanced, too slow and you miss moves, too sensitive and you overtrade
Real Trade Example
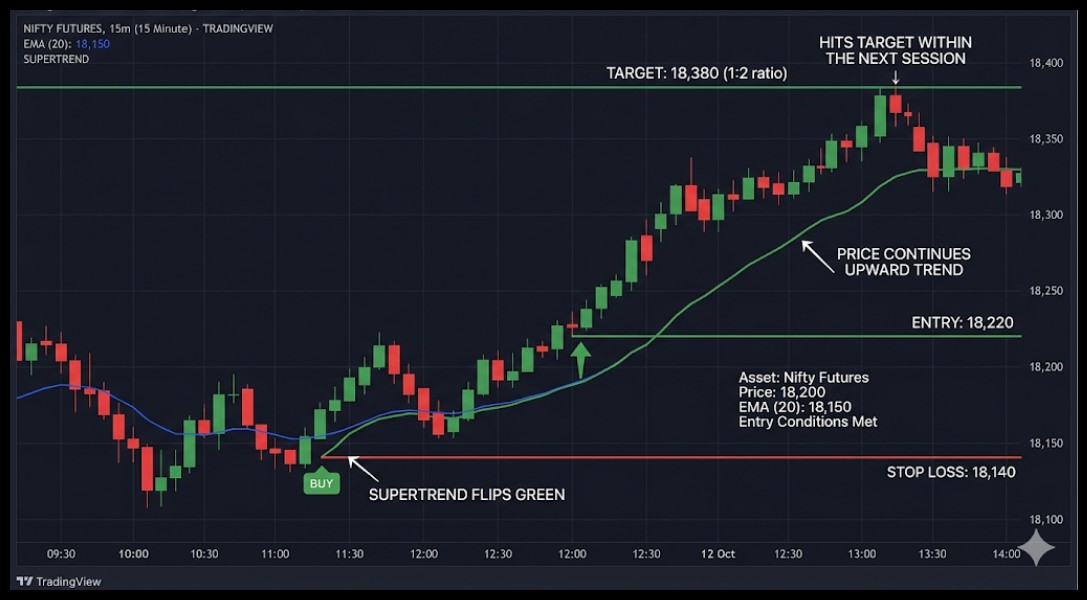
Let’s dissect this using a real-world example. This example shows how traders plan entry, manage risk, and exit with clarity.
Trade Setup:
- Asset: Nifty Futures
- Price: 18,200
- EMA (20): 18,150
- Supertrend flips green
Entry Conditions:
- Price above EMA
- Supertrend confirms bullish trend
- Entry at: 18,220
Stop And Target:
- Stop loss: 18,140
- Risk: 80 points
- Target: 18,380 (1:2 ratio)
Outcome:
- Price continues upward trend
- Hits the target within the next session
In actual markets, this is how the EMA and Supertrend Trading Strategy operates. Clearly stated risk, a planned departure, and a clear entry.
Common Mistakes Made in EMA And Supertrend Strategy
If applied improperly, even a straightforward tactic can backfire. Ignoring the broader market trend or trading during low-volume periods leads directly to unnecessary losses.
Mistakes To Avoid:
- Trading against the EMA direction
- Entering before candle confirmation
- Ignoring stop loss
- Overtrading during sideways markets
The plan is straightforward, but carrying it out requires self-control. Consistent losses are frequently the result of little errors.
Conclusion
Most traders overcomplicate their charts and then wonder why their decisions feel unclear. The EMA and Supertrend strategy solves that by giving you two tools that do one job exceptionally well together.
EMA tells you the direction. Supertrend tells you the moment. When both agree, you trade. When they disagree, you wait.
That is the entire system. Follow the rules, manage the risk, and stop second-guessing every candle. Consistency never comes from finding a better indicator.
It comes from executing the same process repeatedly until it becomes instinct.
Take the next step with our technical analysis classes, where we simplify strategies using real market charts and practical learning.
FAQs
Q1: Is the Supertrend and EMA strategy suitable for beginners?
Ans: Yes, it’s simple to understand. Beginners should steer clear of sideways markets and concentrate on risk management.
Q2: Which EMA works best with a Supertrend approach?
Ans: While 20 or 50 EMA are better for intraday and swing trading, 9 EMA is ideal for scalping.
Q3: Can I use the Supertrend and EMA strategies for swing trading?
Ans: Indeed, it functions on longer timescales, such as daily or 15-minute charts. To improve trend confirmation, use a longer EMA.
Before investing capital, invest your time in learning Stock Market.
Fill in the basic details below and a callback will be arranged for more information:


