

Miss an entry by seconds, and the best part of the trade is already gone.
That’s not an exaggeration; that’s just how fast markets move. One moment, the setup is perfect, the next it’s already played out without you.
The 5 EMA strategy exists to fix exactly that. It’s fast, clean, and built for traders who want to get in early, not after the move is halfway done.
But here’s the thing about speed. It can work for you or against you, depending on how well you understand what you’re looking at. A fast signal is only useful when you know what to do with it.
In this guide, you’ll see how traders actually use the 5 EMA strategy on real charts, with practical insights that go beyond just drawing a line and hoping for the best.
5 EMA Strategy Meaning
The 5 EMA strategy is a short-term trading method that uses the 5-period Exponential Moving Average, a type of moving average calculation designed to track fast price movements.
It reacts quickly to price changes, which makes it popular among intraday traders.
Understanding how to trade EMA crossover setups is the foundation here, but the 5 EMA takes it a step further by hugging the price more closely than traditional averages.
Unlike slower averages, the 5 EMA hugs the price closely. That sounds helpful, but it also means more false signals. So the trick is not just using it, but using it wisely.
Why Do Traders Use The 5 Moving Average Strategy?
Traders use the 5 moving average strategy because it gives early signals. It helps catch trends at the start rather than after the move is done.
- Works well in trending markets
- Ideal for scalping and intraday trading
- Gives faster entry and exit signals
Still, speed comes with noise. That’s where rules matter. Without clear rules, quick signals can turn into quick losses.
5 EMA Strategy Rules That Actually Work
The 5 EMA strategy isn’t just about price crossing a line. Its real power lies in the two-candle entry mechanism that most Indian traders follow: the Alert Candle and the Activation Candle.
This is what separates a proper 5 EMA setup from a generic EMA crossover strategy.
Let us discuss these two in detail with a real chart example:
1. Alert Candle: The First Signal
The Alert Candle is your early signal. Take a look at the chart given below and observe buy and sell setups.
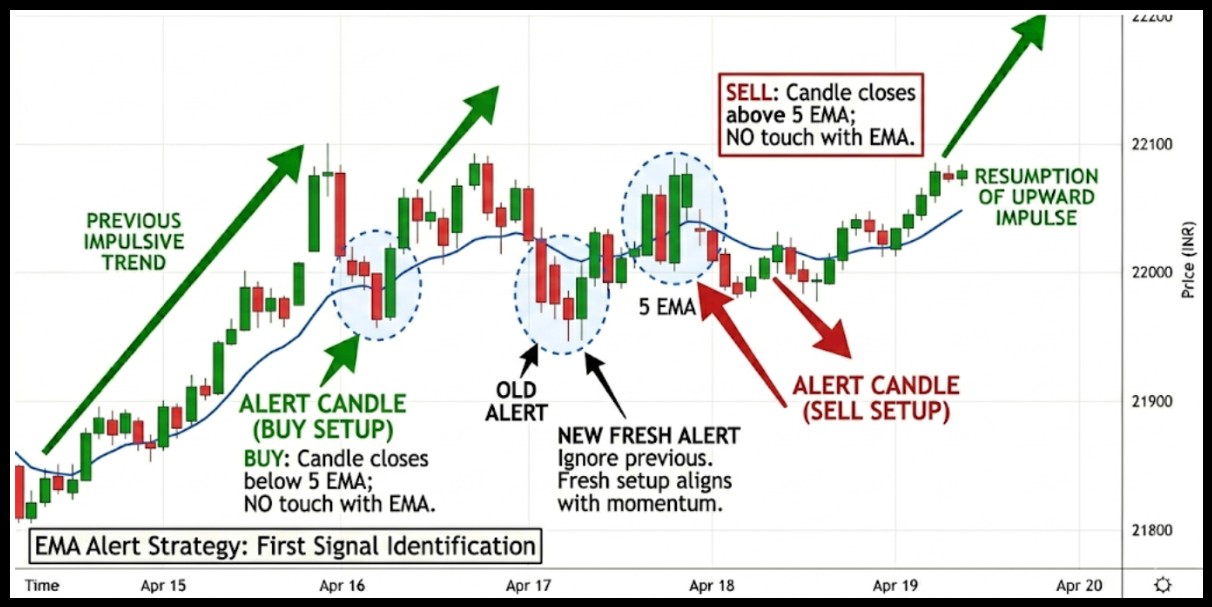
For a buy setup, look for a candle that closes above the 5 EMA line; it can be red or green, but must not touch the 5 EMA line.
For a sell setup, the candle should close above the 5 EMA line without touching it.
- If the next candle also closes cleanly above or below the 5 EMA, ignore the previous alert candle and treat the new one as the current alert.
- This ensures you always have the freshest setup aligned with market momentum.
Note: The alert candle must close entirely above or below the 5 EMA with no part of the candle, including the wick, touching the EMA line. If any part touches the EMA, this is not a valid alert candle.
2. Activation Candle: The Trade Trigger
Once an alert candle is established, the Activation Candle is the candle that triggers your trade.
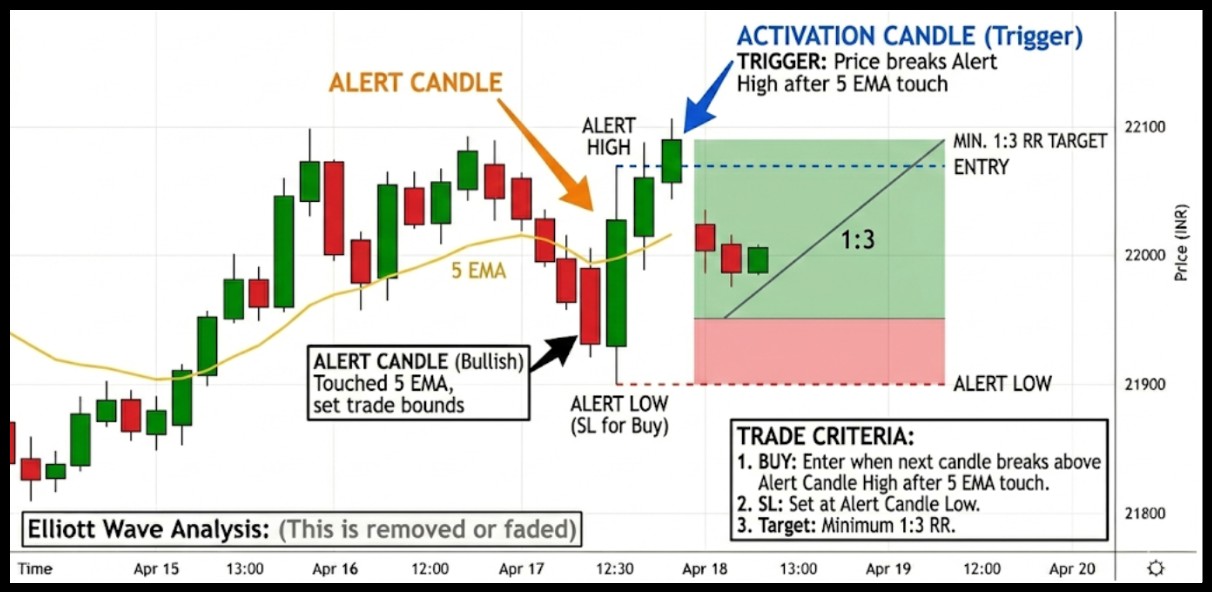
For a buy, the activation candle is the candle that touches the 5 EMA line and then breaks above the high of the alert candle.
This touch confirms that price has interacted with the EMA before the trade is triggered.
For a sell, enter when the next candle breaks below the low of the alert candle after touching the 5 EMA line.
- The stop-loss is set at the alert candle’s low (for buy) or high (for sell).
- Target should follow a minimum 1:3 risk-to-reward ratio.
Why This Works:
- Avoids false breakouts by ensuring price interacts with the EMA before entering.
- Maintains discipline: you only enter trades after a clear two-step confirmation.
- Aligns trades with short-term trends, reducing random noise from irregular markets.
In short, this two-candle mechanism is what makes the 5 EMA strategy highly popular in India. Without it, you’re just following a generic EMA crossover, which often gives inconsistent results.
Discipline in following the Alert and Activation Candle framework is far more important than complicated indicators.
Real Trading Scenario Example
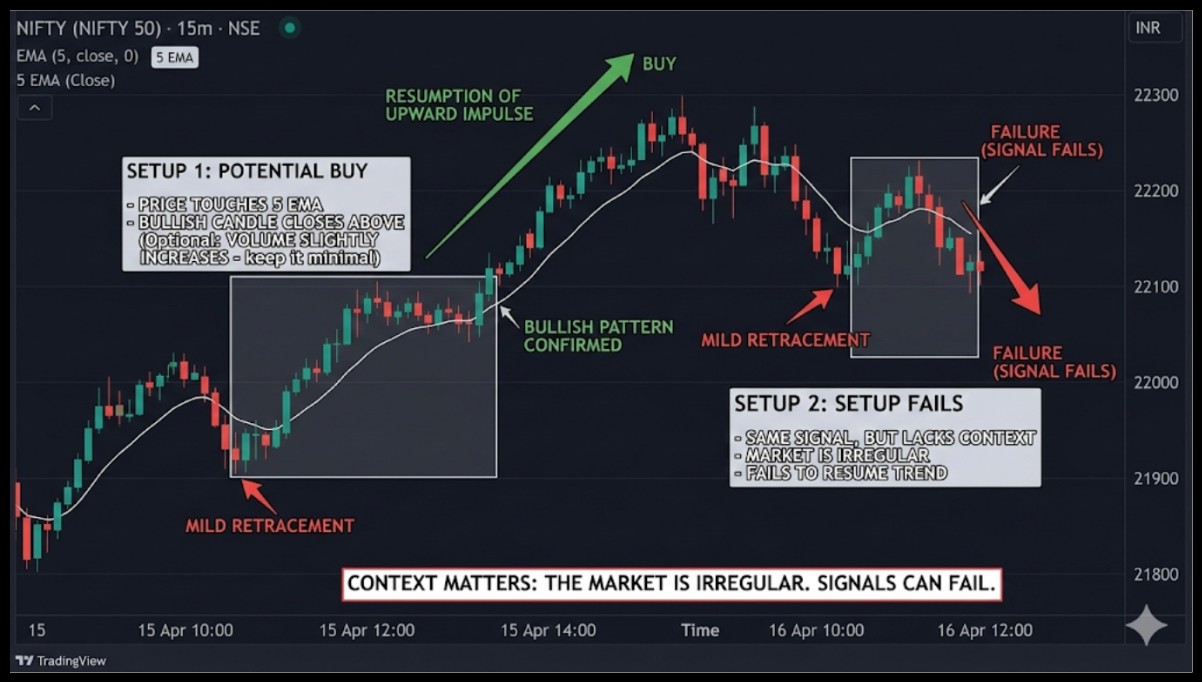
Let’s take the above stock, which is trending upward on a 15-minute chart:
- Price pulls back and touches the 5 EMA
- A bullish candle forms and closes above it
- Volume slightly increases
That’s a potential buy.
Now the contradiction. Sometimes the same setup fails. Why? Because the market is irregular. That’s why context matters more than the signal itself.
5 EMA Strategy Setup And Settings
Getting the 5 EMA strategy setup right is simple. But small tweaks can change results. Even a slight change in timeframe or confirmation indicator can shift your entries and exits noticeably.
That’s why experienced traders often test different setups before settling on what fits their trading style.
Getting the 5 EMA strategy settings right is the first step, but it’s often overlooked. A small configuration change can shift your entire trade outcome, especially with a fast-moving indicator like the 5 EMA.
Here’s how traders typically set it up:
|
Setting |
Value |
| Indicator |
Exponential Moving Average |
|
Period |
5 |
| Price Type |
Close |
|
Timeframe |
5 min, 15 min, or 1 hour |
Most traders keep the settings simple to avoid confusion and over-analysis. The goal is quick decision-making, not perfect signals.
This setup works well on platforms like 5 EMA strategy tradingview, where charts update quickly and allow clean visualization.
Most traders don’t rely on the 5 EMA alone. As part of understanding different types of technical indicators, they combine it with:
- 20 EMA for trend direction
- RSI for momentum
- Volume for strength
- VWAP to identify intraday price positioning and confirm trade bias
This reduces false entries. Not perfect, but better. It adds a layer of confirmation, which helps filter out weak signals.
5 EMA Strategy For Intraday Trading
The 5 EMA strategy for intraday trading works best when markets are active. Early morning sessions often give cleaner moves.
How Intraday Traders Use It:
- Focus on the first 2 hours after the market opens
- Trade breakouts with EMA support
- Exit quickly when the price breaks the EMA
Stick to your plan and avoid chasing every move. Discipline matters more than catching every opportunity.
Risk Management In Intraday:
This is where many traders struggle. Even a solid setup can fail within minutes in fast-moving markets. Discipline matters far more than hunting for the “perfect” entry.
For the 5 EMA strategy, the stop-loss placement is very specific and crucial:
- For buy trades, place your stop loss at the low of the alert candle
- For sell trades, place your stop loss at the high of the alert candle
This ensures that if the price moves against you immediately, your trade exits automatically, limiting potential losses.
Placing the stop below or above the EMA, as sometimes suggested, is incorrect and can expose you to unnecessary losses.
Other essential rules:
- Risk only 1 to 2 percent of your capital per trade
- Avoid revenge trading after a loss
- Accept that even a strong setup can fail; losses are part of trading, not a sign the strategy is broken
What matters is managing risk properly and maintaining consistency over a series of trades. Following the correct stop-loss level allows you to trade confidently, knowing losses are controlled.
5 EMA Strategy for Bank Nifty and Nifty Options
The 5 EMA strategy shines in Indian markets, especially with Bank Nifty and high-volatility stocks.
Its speed and precision make it ideal for intraday scalping and reversal trades, capturing short-term swings effectively.
Timing is crucial when trading Bank Nifty options. Traders often use:
- 5-minute candles for sell trades to catch quick downward moves
- 15-minute candles for buy trades to ride trends upward
Using these timeframes helps balance speed with accuracy, reducing the chances of whipsaws in volatile markets.
This strategy performs best in:
- Bank Nifty options
- High-volatility stocks that show strong intraday moves
Avoid slow or range-bound stocks, as signals often fail to generate profitable trades. These markets move too slowly for the 5 EMA strategy to react effectively, leading to frequent false entries and exits.
Markets to Avoid and Minimum Capital:
- Avoid government stocks like NTPC or ONGC, which trigger frequent stop-losses
- Minimum capital recommended: ₹50,000 per lot due to fast drawdowns in options.
Note that lot sizes and margin requirements are subject to change by exchanges. Always check current margin requirements on your broker platform before trading.
This focused approach ensures traders can manage risk while making the most of short-term opportunities in the Indian market.
5 EMA Strategy Accuracy And Win Rate
Let’s talk numbers. Everyone wants to know the 5 EMA strategy accuracy and the 5 EMA strategy win rate.
There’s no fixed number. But based on typical usage:
- Accuracy ranges between 55 to 65 percent
- Higher in trending markets
- Lower in sideways markets
It may not be groundbreaking, but with good risk management, it works. Even a modest win rate can grow steadily when losses are controlled, and winners are allowed to run.
5 EMA Strategy Backtest Insights
A simple observation from testing the strategy across different market conditions. A basic 5 EMA strategy backtest shows:
|
Market Type |
Win Rate |
|
Trending |
60 to 70 percent |
| Sideways |
40 to 50 percent |
These figures are approximate observations based on general market behavior and are not derived from a verified backtest on any specific instrument or time period.
Backtesting on tools like TradingView helps refine entries. But past results don’t guarantee future profits as market changes and behavior shifts.
Is 5 EMA Strategy Profitable?
A fair question. Is 5 EMA strategy profitable? Yes, but with conditions. It rewards discipline and consistency more than quick, impulsive trades.
When It Works Well:
- Strong trending markets
- High liquidity stocks or indices
- Clear price structure
When It Fails:
- Sideways or irregular markets
- Low volume assets
- News-driven volatility
So, the 5 EMA strategy’s success rate depends more on the trader than the strategy itself. Consistency in following rules and managing risk often matters more than the entry signal itself.
Using 5 EMA Strategy On TradingView And Algo Systems
Technology makes execution easier. It also helps remove hesitation during fast market moves.
With the right setup, execution becomes consistent and less emotional.
1. 5 EMA Strategy TradingView Setup
On TradingView, setting up the 5 EMA strategy is straightforward and visual. You can see price action relative to the EMA in real time, which makes spotting entry and exit points much easier.
- Add the EMA indicator
- Set period to 5
- Combine with alerts for entries
You can even automate alerts for faster decisions. This helps you react instantly without staring at charts all day. It also reduces emotional decisions, since entries follow predefined conditions.
2. 5 EMA Strategy Algo Approach
By automating signals, traders can monitor multiple assets simultaneously without being glued to the screen all day. Some traders build a 5 EMA strategy algo using rules like:
- Entry when price crosses EMA
- Exit on the opposite crossover
- Stop loss based on ATR
Algo trading removes emotions. But it also removes discretion. That’s both good and risky. It ensures rules are followed consistently, eliminating impulsive decisions that often cost traders.
However, it cannot adapt to unexpected market news or sudden volatility like a human trader can, so careful monitoring is still essential.
Final Thoughts
The 5 EMA strategy looks simple, and it is, but simplicity alone doesn’t guarantee easy profits.
It works best when paired with discipline, risk control, and patience, and missing even one of these can turn the best setup into a losing trade.
Follow them together, and even a basic strategy like this can deliver results that compound over time.
What also matters is screen time, because the more you observe how the 5 EMA behaves across different market conditions, the sharper and more confident your entries become.
No guide can replace the pattern recognition that develops from watching price interact with the EMA across hundreds of candles.
Lastly, treat every loss as data rather than failure, since each bad trade tells you something useful about market conditions, entry timing, or risk management.
Traders who journal and review their trades consistently improve far faster than those who simply move on after a loss.
Unlock deeper insights and master the 5 EMA strategy with live market examples in our intraday trading classes.
FAQs
Q1: What Is The Best Timeframe For 5 EMA Strategy?
Ans: 5-minute and 15-minute charts work well for intraday trading. Higher timeframes give fewer but stronger signals.
Q2: Can Beginners Use The 5 EMA Strategy?
Ans: Yes, it’s simple to learn. But beginners should combine it with risk management and avoid overtrading.
Q3: What Is The Average 5 EMA Strategy Win Rate?
Ans: It usually ranges between 55 to 65 percent. Performance improves in trending markets and drops in sideways conditions.
Before investing capital, invest your time in learning Stock Market.
Fill in the basic details below and a callback will be arranged for more information:


