

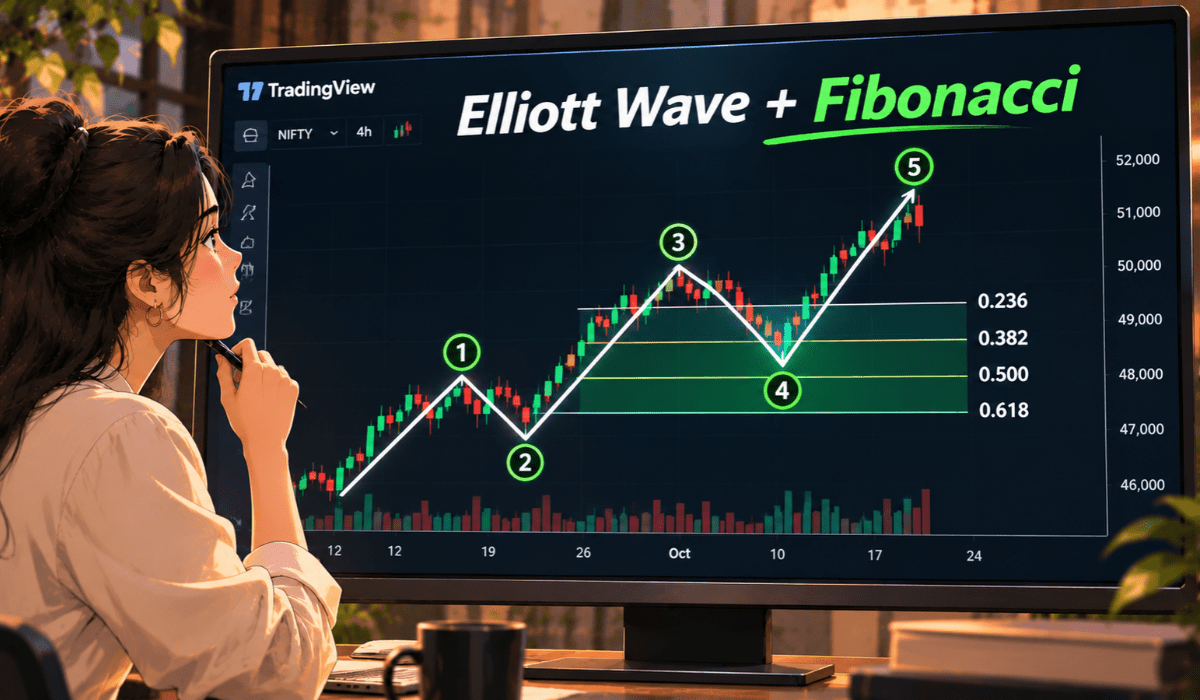
You have counted five waves on a chart, and now you want price levels to watch. That is where fibonacci levels in elliott wave analysis helps, because it turns a rough count into zones you can actually mark.
This post stays on one question. Which retracement levels do wave 2, wave 4 and corrections commonly respect? And which extension levels do wave 3 and wave 5 commonly target? Every number below comes from one hypothetical rupee example.
What Are The Fibonacci Levels Rules or Guidelines?
Fibonacci ratios are guidelines. Price often respects them, but it is free to ignore them, and many valid counts do.
The three core Elliott rules always come first.
- Wave 2 cannot retrace more than 100% of wave 1.
- Wave 3 cannot be the shortest of waves 1, 3 and 5.
- Wave 4 cannot overlap the price territory of wave 1.
If a Fibonacci level and a core rule disagree, the rule wins and the count changes.
I am not re-explaining the full theory here. The broader picture of Elliott wave strategies for trading sits on its own page, so read that first if the wave basics feel new.
Which Fibonacci Levels Does Wave 2 Respect in Elliott Wave?
Wave 2 is the first pullback after the move starts. It is usually sharp, and it often shakes out early buyers.
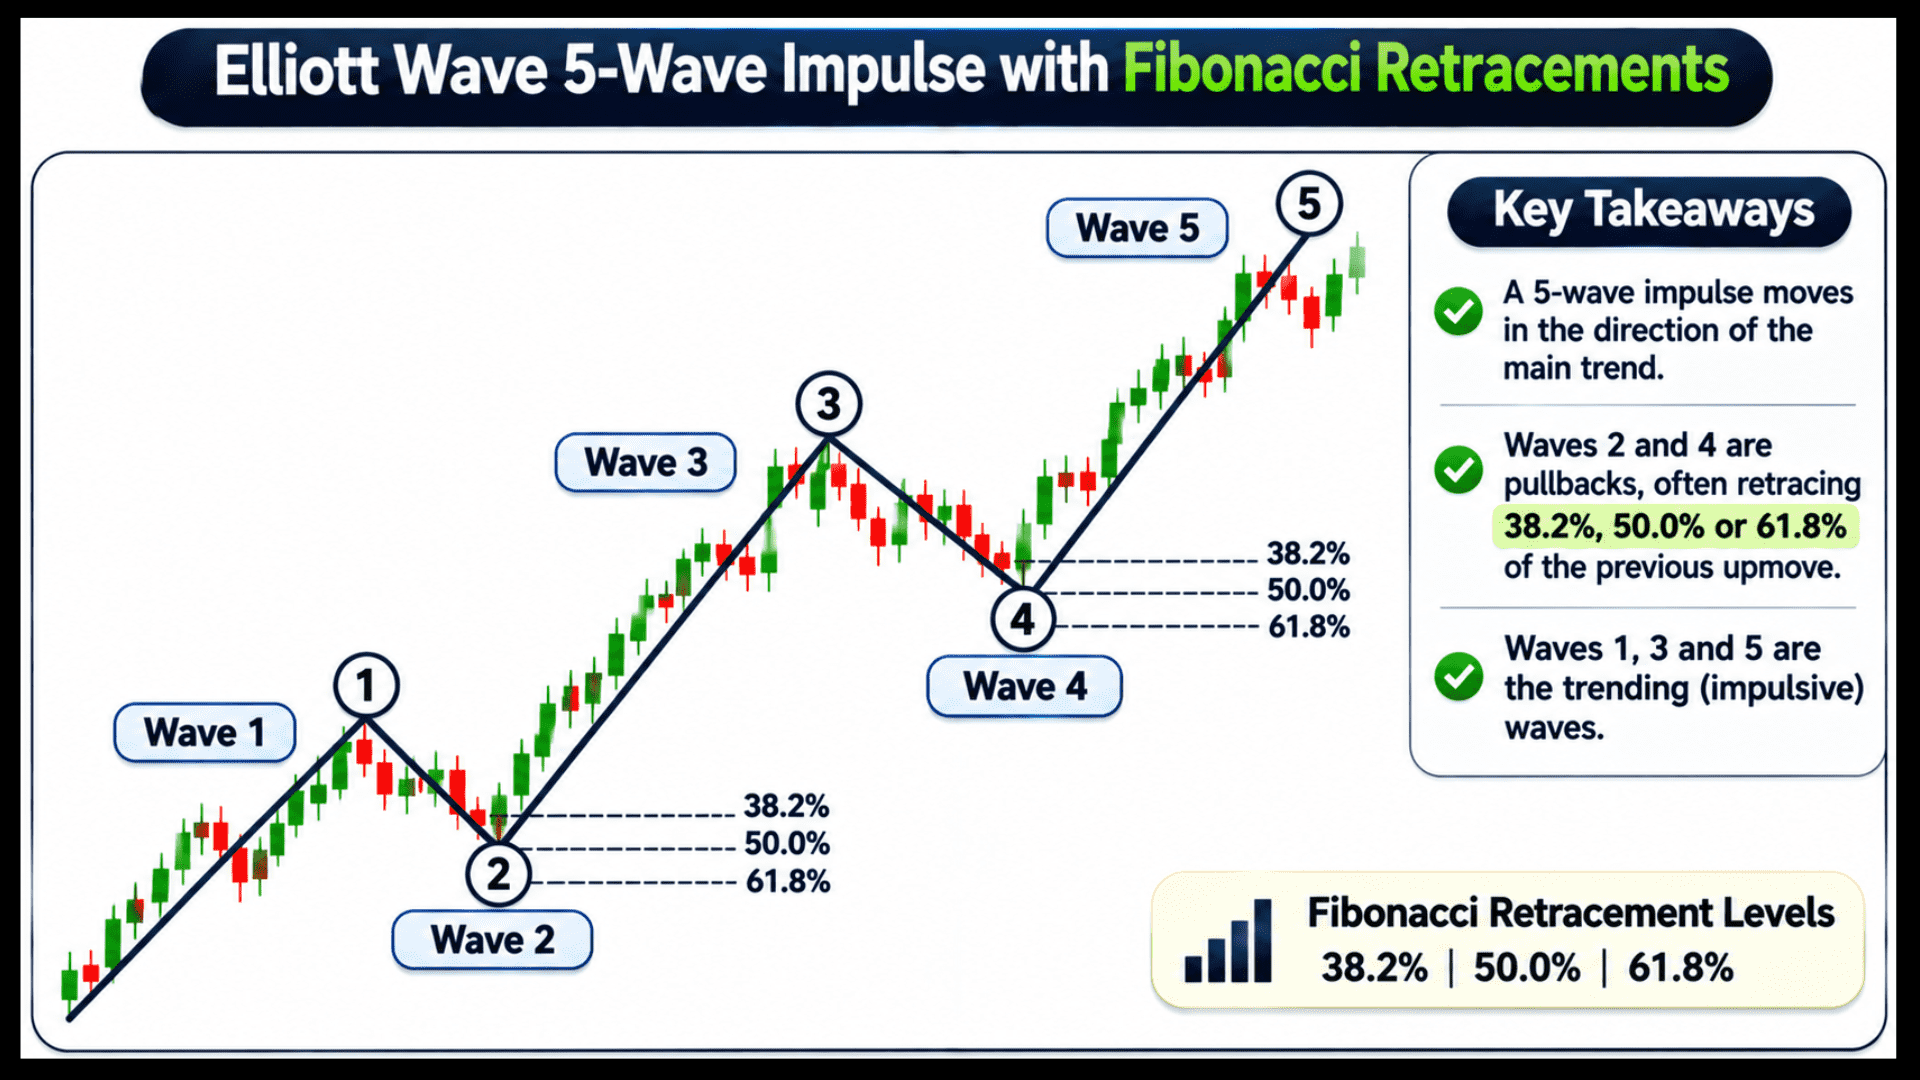
Traders commonly watch the 50% and 61.8% retracements of wave 1. The 38.2% level shows up in strong trends, and 78.6% appears when wave 2 is deep.
Here is how the common retracement zones line up for each pullback in the count.
| Wave | Retraces | Commonly watched levels | Rule limit |
|---|---|---|---|
| Wave 2 | Wave 1 | 50%, 61.8% (also 38.2%, 78.6%) | Never beyond 100% |
| Wave 4 | Wave 3 | 23.6%, 38.2% (also 50%) | No overlap with wave 1 |
| Wave B | Wave A | 38.2% to 78.6% (can go beyond in flats) | Depends on pattern |
A shallow wave 2 near 38.2% often leads to a strong wave 3. A very deep wave 2 near 78.6% is a warning to stay flexible with your count.
Some traders also wait for a pullback to settle near a moving average. A 20 and 50 EMA crossover can give a second opinion before you trust a wave 2 low.
Which Fibonacci Levels Does Wave 4 Respect in Elliott Wave?
Wave 4 is the sideways, tiring pullback inside a trend. It tends to be shallower than wave 2, which is the idea of alternation.
The 23.6% and 38.2% retracements of wave 3 are the usual zones. A 50% pullback is possible, but it leaves little room before the overlap rule with wave 1 is tested.
Always mark the wave 1 high next to your Fibonacci lines. If wave 4 closes below it in a standard impulse, the count is probably wrong, even if a ratio looks perfect.
This is one of the Elliott wave rules that no ratio can override.
Wave 3 Fibonacci Extension: What Is the Usual Target?
Wave 3 is usually the strongest and longest wave. Extensions are measured by projecting a multiple of wave 1 from the end of wave 2.
The most common target is 161.8% of wave 1. Stronger trends can push to 200% or 261.8%, while a weak move may stall near 100%.
These ratios come from the Fibonacci series, and Fibonacci retracement explains that base in simple
These are the extension levels traders usually plot for the two impulse waves.
| Wave | Measured from | Commonly watched levels |
|---|---|---|
| Wave 3 | Wave 1 length, projected from wave 2 low | 100%, 161.8%, 200%, 261.8% |
| Wave 5 | Wave 1 length, projected from wave 4 low | 61.8%, 100% |
| Wave 5 (alternate) | Net distance from start to wave 3 end | 61.8% |
Notice that wave 3 targets cluster at 161.8%. That clustering is why many traders treat it as the first checkpoint, not the final target.
How to Project Wave 5 Fibonacci Targets in Elliott Wave?
Wave 5 is often the weaker, final push. It is commonly projected at 61.8% or 100% of wave 1, measured from the end of wave 4.
When wave 3 was very long, wave 5 often equals wave 1. When wave 3 was modest, wave 5 can stretch further.
A second method uses 61.8% of the net distance from the start of wave 1 to the end of wave 3. If both methods point to the same zone, that overlap is worth marking.
Momentum often fades near a trend top. Some traders watch a short-term average, as in a 9 EMA strategy, to judge if the final push is healthy.
Fibonacci Levels in Corrective Waves (A-B-C): How Do They Work?
After five waves, a correction usually follows. Wave B often retraces 38.2% to 78.6% of wave A.
In a flat pattern, wave B can reach 100% or a bit more. Wave C is commonly 61.8%, 100% or 161.8% of wave A, measured from the end of wave B.
The 100% target is the most frequent. Corrections are also the hardest part of Elliott wave to count in real time.
On short timeframes the noise is higher, so even the best intraday trading time will not make a lower timeframe correction easy to read.
Worked Example: Fibonacci Levels in Elliott Wave in Rupees
Let us put numbers on a hypothetical instrument. This is for illustration only, and the prices are made up.
All levels were computed with a small script, not drawn by eye.
Wave 1 runs from ₹1,000 to ₹1,200, so its length is ₹200. The wave 2 retracement levels from that high are ₹1,123.6 (38.2%), ₹1,100.0 (50%), ₹1,076.4 (61.8%) and ₹1,042.8 (78.6%).
Say wave 2 ends at the 61.8% level, ₹1,076.4. Projecting 161.8% of wave 1 (₹200 x 1.618 = ₹323.6) from there gives a wave 3 target of ₹1,400.0.
The 100% and 200% extensions land at ₹1,276.4 and ₹1,476.4. The 261.8% extension lands at ₹1,600.0.
Now assume wave 3 tops at ₹1,400.0. Wave 3 is then ₹323.6 long.
A 38.2% pullback lands wave 4 at ₹1,276.4, while 23.6% would be ₹1,323.6 and 50% would be ₹1,238.2. All of these sit above the wave 1 high of ₹1,200, so the overlap rule is respected.
From the wave 4 low of ₹1,276.4, a 100% of wave 1 projection gives a wave 5 target of ₹1,476.4. The 61.8% net-distance method (61.8% of ₹400) gives ₹1,523.6.
Wave 5 at ₹200 is shorter than wave 3 at ₹323.6. So wave 3 is not the shortest, which keeps the count valid.
For a correction after that, imagine wave A falls from ₹1,500 to ₹1,380, a drop of ₹120. Those same ratios give the zones below, again for illustration only.
| Level | Price |
|---|---|
| Wave B at 50% of A | ₹1,440.0 |
| Wave B at 61.8% of A | ₹1,454.2 |
| Wave C at 61.8% of A (from B at ₹1,454.2) | ₹1,380.0 |
| Wave C at 100% of A (from B at ₹1,454.2) | ₹1,334.2 |
| Wave C at 161.8% of A (from B at ₹1,454.2) | ₹1,260.0 |
The takeaway is simple. The levels give you zones to watch and a way to plan risk, and they do not tell you where price must stop.
How to Avoid Common Fibonacci Mistakes in Elliott Wave Trading?
Most errors come from forcing a count to fit a ratio. Ratios are a tool for the count, and never the other way round.
Keep these habits in mind before you place a trade based on any level.
- Treat each ratio as a zone, not a single exact price.
- Check the three core rules before you trust any Fibonacci level.
- Look for two or more levels from different waves landing in the same area.
- Use a stop loss based on where your count becomes invalid, not on a round number.
- Stay ready to relabel the count when price breaks an important level.
It also helps to know where this method sits among others. If you are comparing it with older frameworks, see Elliott wave vs Dow theory before you decide how much weight to give it.
Reading about ratios is easy, but real clarity comes from marking them on live charts and getting your doubts solved by a mentor.
In our live classes of 1 to 1.5 hours, you can join from your mobile, ask doubts as they come up and learn step by step. There is no fixed batch, so you can start when you are ready.
Conclusion
Fibonacci levels in Elliott wave work best as a map. Wave 2 often pulls back to 50% or 61.8%, and wave 4 to 23.6% or 38.2%.
Wave 3 often extends to 161.8%, and wave 5 often reaches 61.8% or 100% of wave 1. Remember that these are guidelines, and the three core rules always come first.
Practise on past charts, mark your levels before the move, and review where price actually turned. Building that habit through technical analysis classes makes the whole process faster.
Disclaimer: This post is for education only and is not investment advice. Please verify market rules on the official exchange and SEBI websites.
Frequently Asked Questions
Before investing capital, invest your time in learning Stock Market.
Fill in the basic details below and a callback will be arranged for more information: